Energy Management and Simulation of Photovoltaic/Hydrogen/Battery Hybrid Power System
Energy Management and Simulation of Photovoltaic/Hydrogen /Battery Hybrid Power System
Volume 1, Issue 2, Page No 11-18, 2016
Author’s Name: Tariq Kamala),1, Syed Zulqadar Hassan2
View Affiliations
1Department of Electrical and Electronics Engineering, Sakarya University, Faculty of Technology, Serdivan/Sakarya, Turkey
2State Key Laboratory of Power Transmission Equipment and System Security and New Technology, School of Electrical Engineering, Chongqing University, Chongqing, China
a)Author to whom correspondence should be addressed. E-mail: tariq.kamal.pk@ieee.org
Adv. Sci. Technol. Eng. Syst. J. 1(2), 11-18 (2016); ![]() DOI: 10.25046/aj010203
DOI: 10.25046/aj010203
Keywords: Hybrid Power System, Energy Management, Grid Stability, Power Quality

Export Citations
This manuscript focuses on a hybrid power system combining a solar photovoltaic array and energy storage system based on hydrogen technology (fuel cell, hydrogen tank and electrolyzer) and battery. The complete architecture is connected to the national grid through power converters to increase the continuity of power. The proposed a hybrid power system is designed to work under classical-based energy management algorithm. According to the proposed algorithm, the PV has the priority in meeting the load demands. The hydrogen technology is utilized to ensure long-term energy balance. The battery is used as a backup and/or high power device to take care of the load following problems of hydrogen technology during transient. The dynamic performance of a hybrid power system is tested under different solar radiation, temperature and load conditions for the simulation of 24 Hrs. The effectiveness of the proposed system in terms of power sharing, grid stability, power quality and voltage regulation is verified by Matlab simulation results.
Received: 04 March 2016, Accepted: 20 June 2016, Published Online: 25 June 2016
1. Introduction
Today, pollutants in the atmosphere are progressing in parallel with the increasing demand of energy. The continuous increasing demand for fossil fuels such as natural gas, crude oil and coal is motivating society towards the development of Renewable Energy Sources (RES) power generation. Many such renewable energy sources like Wind Turbine (WT) and solar Photovoltaic (PV), which are clean and abundantly available in nature, are now well developed, cost effective and are being widely used, while some others like Fuel Cells (FC) are in their advanced developmental stage [1]–[3]. The applications PV systems have become more common in both developed and developing countries. The world’s primary energetic consumption is only 1/10,000 of the one available on the surface of sunny countries. If adequately exploited, solar energy may become suf?ciently powerful, providing enough energy for future mankind [4]. PV is scaleable from very small to very large and easy to integrate with existing power converters [5], [6]. However, The output power generated by PV systems is highly dependent on weather patterns. For instance, during a particular period of time (e.g., cloudy or at night), a PV system would not generate any power. Natural variations in solar irradiance and temperature causes power ?uctuations in a PV system. Apart from this, the power generated by a PV system is difficult to store for backup [7]. The best way to address this problem is to propose hybrid power system with proper energy management.
A Hybrid Power System (HPS) utilizes two or more energy sources, power converters and/or storage devices. The main purpose of HPS is to combine multiple energy sources and/or storage devices which are complement of each other. Thus, higher efficiency can be achieved by taking the advantage of each individual energy source and/or device while overcoming their limitations [8]. Recent advancement in FC technology for grid enhancement has exposed its significant potential and consider an indispensable energy source for the future power system. FC is a static energy source that generates electricity from hydrogen through electrolysis. The superior reliability, with practically zero noise level or no moving parts is an extra advantage of FC system as compared to the diesel generator. Main characteristics of FC include modularity, near zero emissions, fuel flexibility, premium power quality, high efficiency and practically low noise levels. Other advantages of FC are the distributed and centralized configurations, diversity of fuels, cogeneration options and reusability of exhaust gases for heating of buildings [9]. The combined use of FC with an Electrolyzer (ELZ), hydrogen storage tanks and compressor unit provide a new energy storage concept. Since, hybridization of FC stacks with PV panels will, therefore, form an alternate energy conversion system where the FC acts as back up during low PV outputs to satisfy sustained load demands. There are several types of FCs which are classified on the basis of their operating temperature ranges and type of electrolyte. In this study, Solid Oxide Fuel Cell (SOFC) is selected, because, it works at high temperatures (800 – 1000 °C) [10]. But, the main weak point in SOFC is their poor dynamic response, gas starvation and load tracking delays [11]. When a SOFC is subjected to a step increase in load, it shows an instant drop off of the voltage in the V-I curve and take several seconds to provide the desired power. In the meantime, the SOFC may be starved of fuel, which can seriously affect the life time of SOFC [12]. This problem can be addressed by using a high energy density device such as a battery. Therefore, the SOFC should be utilized under controlled steady-state environment while the battery is supplying the demanded power. Without the battery bank, the SOFC system must provide all the power demand, thus oversize and increase the cost of the SOFC power plant.Today, pollutants in the atmosphere are progressing in parallel with the increasing demand of energy. The continuous increasing demand for fossil fuels such as natural gas, crude oil and coal is motivating society towards the development of Renewable Energy Sources (RES) power generation. Many such renewable energy sources like Wind Turbine (WT) and solar Photovoltaic (PV), which are clean and abundantly available in nature, are now well developed, cost effective and are being widely used, while some others like Fuel Cells (FC) are in their advanced developmental stage [1]–[3]. The applications PV systems have become more common in both developed and developing countries. The world’s primary energetic consumption is only 1/10,000 of the one available on the surface of sunny countries. If adequately exploited, solar energy may become suf?ciently powerful, providing enough energy for future mankind [4]. PV is scaleable from very small to very large and easy to integrate with existing power converters [5], [6]. However, The output power generated by PV systems is highly dependent on weather patterns. For instance, during a particular period of time (e.g., cloudy or at night), a PV system would not generate any power. Natural variations in solar irradiance and temperature causes power ?uctuations in a PV system. Apart from this, the power generated by a PV system is difficult to store for backup [7]. The best way to address this problem is to propose hybrid power system with proper energy management.
2. Literature Review
A considerable literature on hybrid power systems are discussed and published in academia at other active forums too. For example, a hybrid photovoltaic fuel-cell generation system employing an electrolyzer for hydrogen generation and battery for storage purpose is designed and simulated in [13]. The performance of a hybrid system using an ELZ/FC/diesel generator are given in [14]. The simulation results of a grid dependent hybrid system integrating a FC, PV and wind for distributed energy applications are shown in [15]. The designing of PV/FC/wind hybrid system for proper energy management is presented in [16]. A wind based power system with hydrogen storage is simulated in [17]. In [18], the author design a management system for FC with a battery hybrid tramway. References [19]–[22], proposed an autonomous control scheme for the interlinking converter whose responsibility was to link AC and DC sub-microgrids together to form the hybrid AC/DC microgrid. The work performed in [15], dealt about the hybrid system which contains wind/PV/FC. The main purpose of this research paper is to provide uninterrupted supply to the load, it is achieved by using FC which operates at rated power of 10 kW, in the event of worst environmental conditions where there is no generation from wind and PV resources. The proposed system is simple, easy to control and low cost. In [23], the dynamic behavior and performance of the hybrid system is evaluated. The hybrid system consists of wind and PV resources and the system is grid-connected. The overall system consists of DC–DC converter, grid interface inverter, hybrid system and appropriate power control strategy, which draws maximum power from the wind turbine by using a variable speed control method and extracts maximum energy from the PV array using the Maximum Power point Tracking (MPPT) technique. The simulation models are developed in PSCAD/ EMTDC environment and the results showed very good performance of hybrid system in response to variations in solar irradiance and wind speed. In [24], the authors presented modeling and control of photovoltaic/wind/fuel cells hybrid generating system. The overall work is divided into two parts. In the ?rst part the authors focused on each subsystem and different parameters are identi?ed for each subsystem. The second part dealt with the design and installation of various equipment which includes voltage and current sensors, the data acquisition is made possible by using National Instruments cards which allowed to obtain real time data in LabVIEW environment. Similarly, several authors focused on hybrid power system on different issues various such as the size and cost optimization [25]–[27], power management [28]–[31], power quality and reliability [32]. There are some drawbacks in all the above mentioned studies. For example, some authors include short energy system in their studies, while others concentrate on long term storage medium. Some authors describe power control of PV system while others attempt to address the energy management without providing power sharing among different energy sources and/or storage system. In addition to this, most of the authors supported their studies on the basis of virtual generated solar irradiance, temperature and weather patterns.
This work presents a grid connected HPS combining PV, SOFC, battery and ELZ while considering the real wind speed and load variations for the hundred households at Peshawar, the capital of KPK, Pakistan. The proposed HPS works under the supervision of Classical-based Energy Management and Control Algorithm (CEMCA). The proposed algorithm effectively managed all the energy sources and storage system according to different weather patterns and load conditions. The proposed combination and algorithm ensures 24 Hrs power flow with better reliability and stability. The said combination signifies the most suitable option which ensures to maximize the output energy, continuity of power and decrease the variations in output power.
This paper is organized as follows. First, system description is focused in Section 3. Next, Section 4 explains the control of system components. Section 5 focuses on the energy management of the entire system. Simulation results are given in Section 6 followed by the conclusion in Section 7.
3. Description of Proposed Hybrid Power System
The complete system is designed in two buses i.e., DC and AC bus. PV, SOFC, ELZ and battery make the architecture of DC bus, and the power conversion and transferring occurs between these components through a CEMCA. Domestic load and national grid are the parts of AC bus. The output voltages of PV and SOFC are regulated and adjusted through two non-isolated DC–DC boost converters. The boost converter is controlled through Proportional Integral Differentiator (PID) controller. The bidirectional power flow of battery with the rest of the system occur through a buck boost converter. The buck boost converter is controlled through Proportional Integral (PI) controller. The output of DC bus provides the required power to the grid and grid-connected load through three phase inverter even if only one source is available. The inverter is controlled via hysteresis current control strategy.
It is important to describe that the proposed HPS is flexible and, therefore, easily upgradable as long as a new PV, SOFC and battery are added to the existing ones without increasing the circuit complexity. Furthermore, it is also possible to add another parallel inverter to expend the said design with high ef?ciency. The assessment of the performance and stability of the proposed CEMCA necessitates the simulation of the integrated system over a period of time. Therefore, steady-state simulation models have been employed for each distinct unit.
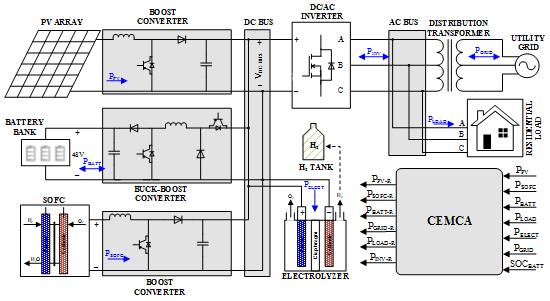
Figure 1: Architecture of proposed hybrid power system
4. Control of System Components
4.1. Control of PV System
The output power of PV depends upon the atmospheric condition, therefore, to track the maximum power point (MPP) of the PV, a single boost stage is applied to boost the PV voltage. The output current and voltage of the PV are used to compute MPPT error denoted as “e” in figure 2. The MPPT error is calculated using an incremental conductance algorithm. The boost converter is controlled by proportional integral differentiator (PID) controller. The PID controller tries to minimize the MPPT error. The output of PID represents the variation in duty cycle.
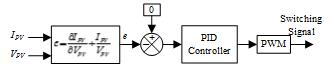
Figure 2: Control diagram of PV system
4.2. Control of SOFC System
The assembly of SOFC is linked with DC bus through boost converter. Here, the boost converter is controlled via PID controller. The PID controller tries to reduce the error, which is the difference of reference voltage by CEMCA and actual voltage of SOFC. The output of PID controller denotes the variation in duty cycle. The output voltage generated by boost converter is based on duty cycle provided by PWM generator. The control system for SOFC is depicted in figure 3.
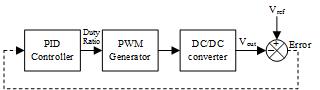
Figure 3: Control diagram of SOFC/ELZ system
4.3. Control System of Electrolyzer
The output power of ELZ is controlled by controlling its input current. A buck converter is used to regulate the input current of ELZ which consequently control the output power. The buck converter is itself controlled by a PI controllers. The control system for ELZ is shown in Figure 3.
4.4. Control of Battery System
The linking of the battery to the DC bus is established though DC-DC buck-boost converter. The power flow from the battery to the DC bus is made via boost mode while the buck mode is used to charge the battery from DC bus. The PID controllers are used to control the battery buck-boost converter. The control diagram of buck-boost converter is depicted in figure 4. IR is the reference current calculated as IR=PBATT-R/VBATT.
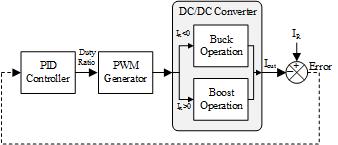
Figure 4: Control system of battery
4.5. Control of Inverter
The DC bus of the HPS is connected to the grid through a three phase inverter. Here, the inverter is controlled using PI controllers followed by hysteresis current control scheme as depicted in figure 5. The proposed control scheme generates suitable pulses for driving the controllable switches of the inverter. The PI controllers try to reduce the error which is the difference between the reference and actual values of the active and the reactive powers. The PI controllers adjust the error and thus control the corresponding powers. It is essential for the grid current to be in phase with the grid voltage and has unity power factor. Therefore, a phase locked loop is used which estimates and adjusts the phase angle of grid voltage. The estimated phase voltage angle is then used to synchronize the inverter to the grid.
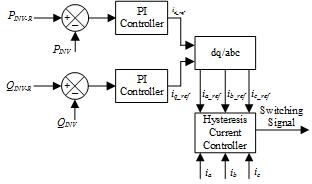
Figure 5: Control system of grid connected inverter
5. Operation of CEMCA
The PV system selected in this work is capable of providing 261 kW of power at best radiation and temperature while the fuel cell (FC) is a 200 kW power plant. In this research work, a SOFC is selected, because, among the various types of FCs, SOFC has the maximum efficiency of about 50-65%. A pressurized 50 kW alkaline ELZ is used for hydrogen production. The hydrogen is stored in a tank for later use in the SOFC. A battery bank of capacity 50 Ah is used in parallel with SOFC. The function of the SC bank is to store the excess power from DC bus and then supply it back in case it is needed. Apart from this, the mismatches and load following problems of SOFC are compensated by SC. A control approach is designed to meet load demands throughout the day and after sunset by using the PV/SOFC/ ELZ/battery hybrid system. The CEMCA controls the whole energy measurement. Based upon the required measurement, the CEMCA generates the commands for the power converters attached to the inputs/outputs of the components used in the hybrid system.
The operating strategies employed in the CEMCA are as follows:
- The use of power generated by the PV system has the priority in meeting load demand over that delivered by the SOFC system or by the battery bank.
- If the power generated by PV system is higher than the demand, the excess power will be used to charge the battery bank.
- If still excess power is available, then it will be sent to ELZ to produce hydrogen for SOFC.
- Similarly, if the total power generated by the PV system is less than the demand, power will be delivered from the SOFC.
- If the load demand exceeds the power generated by the PV/SOFC combination, the difference is supplied by the battery bank.
For explanation of algorithm shown in figure 6, it is better to divide the operation of CEMCA into several modes. Mode I: PV disconnected SOFC disconnected Battery discharging (PDSDBD), Mode II: PV disconnected SOFC connected Battery discharging (PDSCBD), Mode III: PV connected SOFC disconnected Battery charging (PCSDBC), Mode IV: PV connected SOFC disconnected Battery disconnected (PCSDBD).
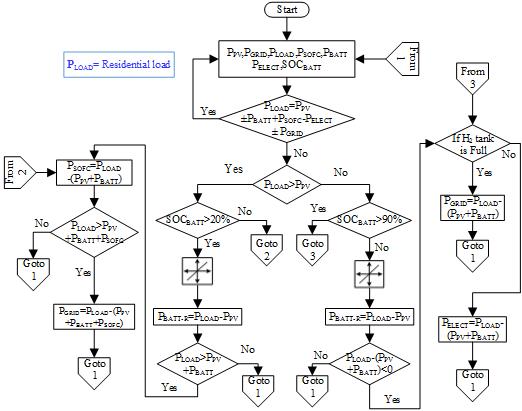
Figure 6: Flow chart of proposed algorithm
5.1. Mode I: PDSDBD
In this operating mode, the power generated by PV is zero due to low irradiance or bad weather i.e., PPV < PLOAD. Thus, the need of battery and SOFC is essential. The CEMCA checks the battery SOC and if sufficient charge is available, CEMCA controls the buck-boost converter to deliver its maximum power and applying a reference PBATT-R = PLOAD – PPV as shown in figure 6. Hence all the power demand is provided by the battery itself.
5.2. Mode II: PDSCBD
This mode is similar to the mode I, but the difference in both modes is the involvement of SOFC which is absent in mode I. Alike mode I, the PV and battery goes in same fashion. As the power demand is not satisfied with the battery alone, so, SOFC is acting as an active player in this mode. The remaining power demand reference is given to the boost converter of SOFC by CEMCA which is  as shown in figure 6.
5.3. Mode III: PCSDBC
This mode is applicable when PV is generating excess power i.e., PPV > PLOAD. So in this mode, there is no need of SOFC. The excess power generated by PV system is sent to the battery with reference power PBATT-R = PPV – PLOAD as shown in figure 6. The electrolyzer will consume any excess power present inside the system. Here, there are two conditions for excess power (a) when battery is charging on its maximum power (i.e., 30 kW) remaining excess power is still inside the system (b) the battery is fully charged and then the remaining power exists inside the system. From the above two conditions, the first condition is incorporated in this mode while the second condition will be employed in next mode. Hence, in this mode, the battery is charging with its maximum power and remaining power is consumed by the electrolyzer as shown in figure 6.
5.4. Mode IV: PCSDBD
In this operating mode, the PV is generating power greater than the load demand. Therefore, the excess power is sent to battery bank or electrolyzer depending upon the status of the state of charge (SOC) of battery i.e., SOCBATT < 90% and tank pressure. If the SOC of the battery reaches its maximum value, the second condition (discussed in previous mode) is fulfilled.
6. Simulation Results and Discussion
In this section, first weather and load data are discussed. Secondly simulation results of various modes are described and validated.
6.1. Weather statistics
The weather data used in this HPS are ambient temperature (°C) and solar irradiance (W/m2). The temperature is collected on hourly basis while solar irradiance is taken at the interval of half an hour. The weather data used in this paper are of a typical summer day in Islamabad as shown in figure 7.
6.2. Dynamic Load
In this paper, HPS is grid connected and standalone. The HPS provides power to Residential Load (RL). In Peshawar, fixed power is determined by inflexible loads like ceiling fan, air conditions, refrigerators etc. For lighting load, the power consumption is calculated by using averaging. The peak load and average load are calculated as 2.8 kW and 2.02 kW per home. The peak load starts from 18 Hrs and ends at 21 Hrs.
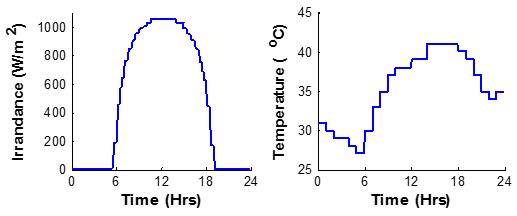
Figure 7: Weather statistics of Peshawar
6.3. Simulation Results
The simulation is carried out under different circumstances .viz. irradiance, temperate, peak and off-peak load. The simulation time is divided into various sections based on the behaviour of different energy sources.
The powers of PV, SOFC, battery, electrolyzer, Utility Grid (UG) and RL at different intervals are shown in figures 8-13. The first time interval is selected such that when the irradiance level is zero i.e., from midnight to 6 Hrs and it represents the mode I. In the same fashion, others are selected and described later on. From figure 8(a) the RL varies from 70-140 kW. The reference is represented by dotted lines while actual power is shown with solid lines. According to the algorithm, the PV first tries to stratify the load, but due to no radiation, PV does not generate any power as depicted in figure 8(c). After PV, the battery delivers its maximum power (30 kW) as illustrated in figure 8(e) but the battery does not fulfill the load demand. Therefore, the remaining power demand is shared between SOFC and grid as shown in figure 8(b) and (d). To keep the system stable, this excess power is consumed by the electrolyzer as shown in figure 8(f).
The second range of interval is selected in which irradiance level starts increasing gradually (i.e., 6-7 Hrs) and mode II also lies in this interval. The PV starts generating power as shown in figure 9(c). From figure 9(a), the RL is 130 kW whereas PV production is 100 kW. The remaining power demand of load is satisfied from battery, SOFC and grid as shown in figure 9(e), (d) and (b). After 6.5 Hrs, the PV generates 150 kW power which is greater than load demand. Therefore, the excess power is first sent to a battery for charging and then sent to electrolyzer as shown in figure 9(e) and (f). This interval contains a switching of mode I to II to III. Mode I ends at 6.1 Hrs whereas mode II lies between 6.1-6.5 Hrs and after that mode III begins.
The third and fourth time slots are selected in such a way that the PV generates power greater than RL demand. Third and fourth slot contains mode III and mode IV respectively. Figure 10 describes the mode III which starts from 7-12.5 Hrs. In this interval, RL varies from 150-200 kW whereas PV output power varies from 180-260 kW as shown in figure 10(a) and (c). Thus, PV is generating sufficient power to meet the load demand and excess power is first sent to a battery for charging (30 kW) and remaining excess power is sent to the grid and electrolyzer as explored in figure 10. As there is no need of SOFC, because, all the load demand is satisfied with PV, so its output power is zero throughout this interval as depicted in figure 10(f).
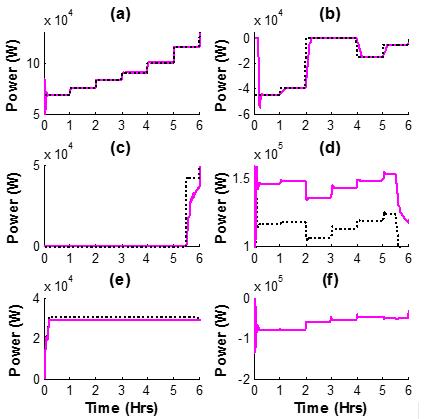
Figure 8: Matlab Simulink output powers with references for Mode-I (a) RL (b) UG (c) PV (d) SOFC (e) Battery (f) Electrolyzer
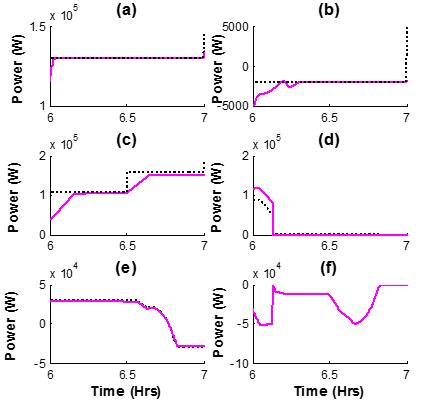
Figure 9: Matlab Simulink output powers with references for Mode-II (a) RL (b) UG (c) PV (d) SOFC (e) Battery (f) Electrolyzer
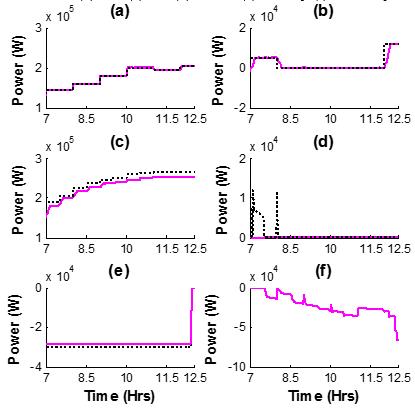
Figure 10: Matlab Simulink output powers with references for Mode-III (a) RL (b) UG (c) PV (d) SOFC (e) Battery (f) Electrolyzer
The fourth time slot starts from 12.5-18 Hrs and it contains mode IV. This time interval is similar with previous interval slightly variation in UG output power and RL demand. Alike previous interval, the PV output power is greater than load demand and excess power is sent to battery but it is already fully charged so, its power is zero as shown in figure 11.
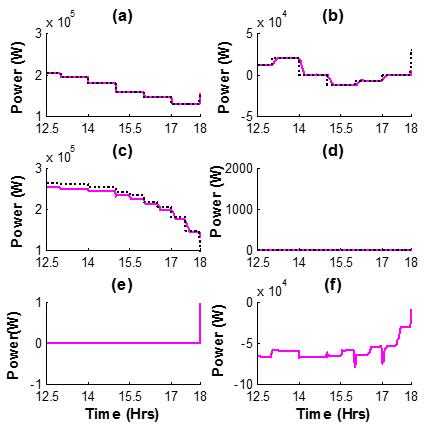
Figure 11: Matlab Simulink output powers with references for Mode-IV (a) RL (b) UG (c) PV (d) SOFC (e) Battery (f) Electrolyzer
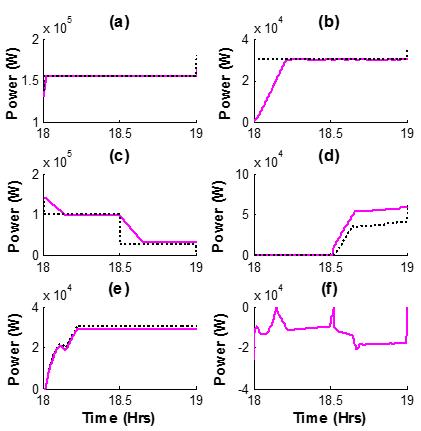
Figure 12: Matlab Simulink output powers with references for switching of modes (a) RL (b) UG (c) PV (d) SOFC (e) Battery (f) Electrolyzer
The next interval represents the evening time. The PV output power tends to zero because of the low irradiance level as illustrated in figure 12(c). This interval is again a switching between modes IV to II to I. The mode IV lies upto 18.3 Hrs whereas mode II lies between 18.3-18.5 Hrs and after that mode I starts. The RL is 150 kW, which gives a sense that there is a need of battery bank. Therefore, the battery is trying to fulfill the load demand by providing its maximum power (i.e., 30 kW) and the remaining load demand is fulfilled by SOFC as shown in figure 12 (e) and (d). Usually the peak load starts from evening time, the UG also acts as a load and taking 30 kW of power from renewables as shown in figure 12(b). The SOFC is generating some excess power than it reference which is consumed by the electrolyzer to keep the system stable as shown in figure 12(f).
The final time slot starts from the evening (i.e., 19 Hrs) to midnight and contains mode I. This time interval contains the peak load of the day, i.e., 210 kW and PV is off. In the same fashion during peak load, rather than taking power from the UG, it’s a better option to take power from the battery and SOFC to satisfy load demand. Hence, figures 13 reveals that the battery is providing its maximum power and SOFC satisfies the remaining load demand and excess power is sent to the UG and an electrolyzer.
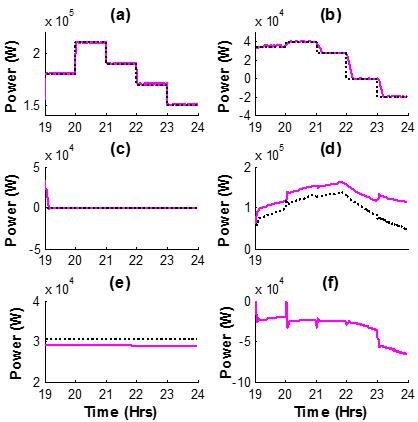
Figure 13: Matlab Simulink output powers with references for Mode-I (a) RL (b) UG (c) PV (d) SOFC (e) Battery (f) Electrolyzer
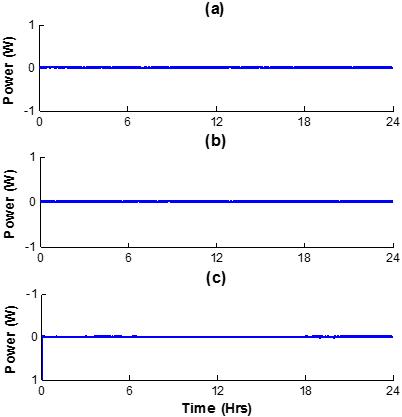
Figure 14: Net power on different busses
The system is called as stable one when all the power inside it is zero. If a system contains real power, then it alters the line- to-line voltage of the load while if a system contains reactive power, it alters the frequency of load voltage. It is clear from figure 14 that the net real and reactive powers on the AC side and net DC power on DC side are zero during peak and off-peak hours. This analysis shows the effectiveness of the proposed system in terms of stability and power quality.
Similarly the net power on the DC bus alters the DC bus voltage which causes in harmonics. From figure 15, it is clearly revealed that the net real and reactive powers on the AC side and net DC power on DC side are zero. Furthermore the figure 15 shows that the DC bus voltage is inside standard limits [33].
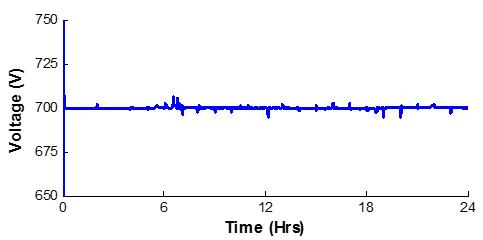
Figure 15: DC bus voltage
7. Conclusion
This paper concludes a classical based energy management and power control of HPS, which is composed of renewable energy source (PV), hydrogen energy (SOFC), and battery. The proposed CEMCA removes the de?ciency of a single power source and provides a PV/SOFC/ELZ/Battery HPS which meets the load demand for 24 Hrs without any interruption. The dynamic behavior of the proposed HPS is tested under real-world record of wind speed and load variations. Matlab simulation is performed to confirm the effectiveness of the developed system in terms of load tracking, voltage regulation, power quality and grid stability
Conflict of Interest
The authors declare no conflict of interest.
Acknowledgment
The authors wish to thank Turkish Burslar? international scholarship program 2015-2016 for financial support during the completion of this research work.
- M. B. A. Zahran, “Photovoltaic Hybrid Systems Reliability and Availability,” J. Power Electron., 3(3) 145–150 (2003). (Online Link)
- S. Z. Hassan, S. Mumtaz, T. Kamal, and L. Khan, “Performance of grid-integrated photovoltaic/fuel cell/ electrolyzer/battery hybrid power system,” in 2015 Power Generation Systems and Renewable Energy Technologies, PGSRET 2015, 1–8 (2015). http://dx.doi.org/10.1109/PGSRET.2015.7312249
- T. Kamal, S. Z. Hassan, H. Li, S. Mumtaz, and L. Khan, “Energy management and control of grid-connected wind/fuel cell/battery Hybrid Renewable Energy System,” in 2016 International Conference on Intelligent Systems Engineering (ICISE), 161–166 (2016). http://dx.doi.org/10.1109/INTELSE.2016.7475114
- N. A. Ahmed, M. Miyatake, and A. K. Al-Othman, “Power fluctuations suppression of stand-alone hybrid generation combining solar photovoltaic/wind turbine and fuel cell systems,” Energy Convers. Manag., 49(10): 2711–2719 (2008). http://dx.doi.org/10.1016/j.enconman.2008.04.005
- J.-A. Jiang, T.-L. Huang, Y.-T. Hsiao, and C.-H. Chen, “Maximum Power Tracking for Photovoltaic Power Systems,” 淡江理工學刊, 8(2), 147–153 (2005). (Online Link)
- W. Tian, Y. Wang, J. Ren, and L. Zhu, “Effect of urban climate on building integrated photovoltaics performance,” Energy Convers. Manag., 48(1): 1–8 (2007). http://dx.doi.org/10.1016/j.enconman.2006.05.015
- K. Mitchell, M. Nagrial, and J. Rizk, “Simulation and optimisation of renewable energy systems,” Int. J. Electr. Power Energy Syst., 27(3): 177–188 (2005). http://dx.doi.org/10.1016/j.ijepes.2004.10.001
- S. Rehman and L. M. Al-Hadhrami, “Study of a solar PV–diesel–battery hybrid power system for a remotely located population near Rafha, Saudi Arabia,” Energy, 35(12): 4986–4995 (2010). http://dx.doi.org/10.1016/j.energy.2010.08.025
- T. F. El-Shatter, M. N. Eskandar, and M. T. El-Hagry, “Hybrid PV/fuel cell system design and simulation,” 2002. http://dx.doi.org/10.1016/S0960-1481(01)00062-3
- T. Das and S. Snyder, “Adaptive control of a solid oxide fuel cell ultra-capacitor hybrid system,” in Proceedings of the 2011 American Control Conference, 3892–3898 (2011). http://dx.doi.org/10.1109/TCST.2011.2181514
- T. Allag and T. Das, “Robust Control of Solid Oxide Fuel Cell Ultracapacitor Hybrid System,” IEEE Trans. Control Syst. Technol., 20(1): 1–10 (2011). http://dx.doi.org/10.1109/TCST.2010.2098478
- P. Thounthong and P. Sethakul, “Analysis of a Fuel Starvation Phenomenon of a PEM Fuel Cell,” in 2007 Power Conversion Conference – Nagoya, 731–738 (2007). http://dx.doi.org/10.1109/PCCON.2007.373048
- S. Islam and R. Belmans, “Grid independent photovoltaic fuel-cell hybrid system: optimal design and control strategy,” in 19th European photovoltaic solar energy, 3311–3314 (2004). (Online Link)
- T. Senjyu, T. Nakaji, K. Uezato, and T. Funabashi, “A Hybrid Power System Using Alternative Energy Facilities in Isolated Island,” IEEE Trans. Energy Convers., 20(2): 406–414 (2005). http://dx.doi.org/10.1109/TEC.2004.837275
- D. Das, R. Esmaili, L. Xu, and D. Nichols, “An optimal design of a grid connected hybrid wind/photovoltaic/fuel cell system for distributed energy production,” in 31st Annual Conference of IEEE Industrial Electronics Society, 2005. IECON 2005., (2005). http://dx.doi.org/10.1109/IECON.2005.1569298
- T. F. El-Shater, M. N. Eskander, and M. T. El-Hagry, “Energy flow and management of a hybrid wind/PV/fuel cell generation system,” in International Journal of Sustainable Energy, 25(2): 91-106 (2006).
- H. De Battista, R. J. Mantz, and F. Garelli, “Power conditioning for a wind–hydrogen energy system,” J. Power Sources, 155(2): 478–486 (2006). http://dx.doi.org/10.1080/14786450600631483
- P. Garcia, L. M. Fernandez, C. A. Garcia, and F. Jurado, “Energy Management System of Fuel-Cell-Battery Hybrid Tramway,” IEEE Trans. Ind. Electron., 57(12): 4013–4023 (2010). http://dx.doi.org/10.1109/TIE.2009.2034173
- C. Chi Jin, P. C. Loh, P. Peng Wang, Y. Yang Mi, and F. Blaabjerg, “Autonomous operation of hybrid AC-DC microgrids,” in 2010 IEEE International Conference on Sustainable Energy Technologies (ICSET), 1–7 (2010). http://dx.doi.org/10.1109/ICSET.2010.5684456
- P. C. Loh, D. Li, Y. K. Chai, and F. Blaabjerg, “Autonomous Operation of Hybrid Microgrid With AC and DC Subgrids,” IEEE Trans. Power Electron., 28(5): 2214–2223 (2013). http://dx.doi.org/10.1109/TPEL.2012.2214792
- P. C. Loh and F. Blaabjerg, “Autonomous control of distributed storages in microgrids,” in 8th International Conference on Power Electronics – ECCE Asia, 536–542 (2011). http://dx.doi.org/10.1109/ICPE.2011.5944602
- P. C. Loh, D. Li, Y. K. Chai, and F. Blaabjerg, “Autonomous Control of Interlinking Converter With Energy Storage in Hybrid AC–DC Microgrid,” IEEE Trans. Ind. Appl., 49(3): 1374–1382 (2013). http://dx.doi.org/10.1109/TIA.2013.2252319
- S.-K. Seul-Ki Kim, E.-S. Eung-Sang Kim, and J.-B. Jong-Bo Ahn, “Modeling and Control of a Grid-connected Wind/PV Hybrid Generation System,” in 2005/2006 PES TD, 1202–1207, (2006). http://dx.doi.org/10.1109/TDC.2006.1668676
- N. Mezzai, D. Rekioua, T. Rekioua, A. Mohammedi, K. Idjdarane, and S. Bacha, “Modeling of hybrid photovoltaic/wind/fuel cells power system,” Int. J. Hydrogen Energy, 39(27): 15158–15168 (2014). http://dx.doi.org/10.1016/j.ijhydene.2014.06.015
- T. K. A. Brekken, A. Yokochi, A. Von Jouanne, Z. Z. Yen, H. M. Hapke, and D. A. Halamay, “Optimal energy storage sizing and control for wind power applications,” Sustain. Energy, IEEE Trans., 2(1): 69–77 (2011). http://dx.doi.org/10.1109/TSTE.2010.2066294
- T. K. Saha and D. Kastha, “Design optimization and dynamic performance analysis of a stand-alone hybrid wind–diesel electrical power generation system,” Energy Conversion, IEEE Trans., 25(4) 1209–1217 (2010). http://dx.doi.org/10.1109/TEC.2010.2055870
- L. Lingfeng Wang and C. Singh, “Multicriteria Design of Hybrid Power Generation Systems Based on a Modified Particle Swarm Optimization Algorithm,” IEEE Trans. Energy Convers., 24(1): 163–172 (2009). http://dx.doi.org/10.1109/TEC.2008.2005280
- B. Francois, M. el Hadi Lebbal, and S. Lecoeuche, “Real-Time Emulation of a Hydrogen-Production Process for Assessment of an Active Wind-Energy Conversion System,” IEEE Trans. Ind. Electron., 56(3): 737–746 (2009). http://dx.doi.org/10.1109/TIE.2008.2007048
- S.-K. Seul-Ki Kim, J.-H. Jin-Hong Jeon, C.-H. Chang-Hee Cho, J.-B. Jong-Bo Ahn, and S.-H. Sae-Hyuk Kwon, “Dynamic Modeling and Control of a Grid-Connected Hybrid Generation System With Versatile Power Transfer,” IEEE Trans. Ind. Electron., 55(4): 1677–1688 (2008). http://dx.doi.org/10.1109/TIE.2007.907662
- M. L. Rahman, S. Oka, and Y. Shirai, “Hybrid Power Generation System Using Offshore-Wind Turbine and Tidal Turbine for Power Fluctuation Compensation (HOT-PC),” IEEE Trans. Sustain. Energy, 1(2), 92–98 (2010). http://dx.doi.org/10.1109/TSTE.2010.2050347
- E. Muljadi and H. E. McKenna, “Power quality issues in a hybrid power system,” in Conference Record of the 2001 IEEE Industry Applications Conference. 36th IAS Annual Meeting (Cat. No.01CH37248), 2: 773–781 (2001). http://dx.doi.org/10.1109/IAS.2001.955532
- Y. Zhang, A. A. Chowdhury, and D. O. Koval, “Probabilistic wind energy modeling in electric generation system reliability assessment,” Ind. Appl. IEEE Trans., 47(3): 1507–1514 (2011). http://dx.doi.org/10.1109/TIA.2011.2127435
- “IEEE Standard for Interconnecting Distributed Resources with Electric Power Systems,” IEEE Std 1547-2003, 1–28 (2003).