Human Sit Down Position Detection Using Data Classification and Dimensionality Reduction
Human Sit Down Position Detection Using Data Classification and Dimensionality Reduction
Volume 2, Issue 3, Page No 749-754, 2017
Author’s Name: Paul Rosero-Montalvo1,2, a), Daniel Jaramillo1, Stefany Flores1, Diego Peluffo1,3, Vanessa Alvear1, Milton Lopez2
View Affiliations
1Universidad Técnica del Norte, Ibarra- Ecuador
2AInstituto Tecnológico Superior 17 de Julio-Yachay, Yachay-Ecuador
3Corporación Universitaria Autónoma de Nariño, Nariño-Colombia
a)Author to whom correspondence should be addressed. E-mail: roseropal@utn.edu.ec
Adv. Sci. Technol. Eng. Syst. J. 2(3), 749-754 (2017); ![]() DOI: 10.25046/aj020395
DOI: 10.25046/aj020395
Keywords: Chair position, Knn, Pca, Embedded system

Export Citations
The analysis of human sit down position is a research area allows for preventing health physical problems in the back. Many works have proposed systems that detect the sitting position, some open issues are still to be dealt with, such as: Cost, computational load, accuracy, portability, and among others. In this work, we present an alternative approach based on an embedded system to acquire the position-related variables and machine learning techniques, namely dimensionality reduction (DR) and classification. Since the information acquired by sensors is high-dimensional and therefore it might not be saved into embedded system memory, for this reason the system has a DR stage based on principal component analysis (PCA) is performed. Subsequently, the posed detection is carried out by the k-nearest neighbors (KNN) classifier between the matrix stored in the system and new data acquired by pressure and distance sensors. Thus, regarding using the whole data set, the computational cost is decreased by 33 % as well as the data reading is reduced by 10 ms. Then, sitting-pose detection task takes 26 ms, and reaches 75% of accuracy in a 4-trial experiment.
Received: 20 March 2017, Accepted: 19 May 2017, Published Online: 16 June 2017
1. Introduction
The area of analysis and detection of human sit down during workdays and in classrooms has been explored by several studies that uses electronic devices and a wide range of sensors. Mostly, such studies aim at detecting of sitting static positions and determining their influence on the normal development of daily activities [1] [2]. In [3], authors explain that keeping bad/incorrect postures habits may cause attention problems, and loss of motor and brain skills for problem solution and decision making, as well as physical health problems such as muscle rigidity, fatigue and muscle pain [4]. The recognition/detection of sitting poses can be conducted by develop mainly two approaches: Image-processing-based and sensor-based approach [5]. The latter requires presure sensors able to be located on different weight-supporting surfaces by taking into account the pressure distribution over the whole surface.
The most common human positions in chair have been categorized in different manners. For instance, in [6], after performing several experiments, it is determined that there are 10 typic poses. Another study [5] considers 5 poses to develop the detection system. Despite that different systems have been proposed for sitting-pose detection, some open issues are still to be dealt with, such as: Cost, computational load, accuracy, portability, and among others.
In this work, we present an alternative approach based on a embedded electronic system to acquire the position-related variables and machine learning techniques, namely dimensionality reduction (DR) and classification. To design our detection system, we start with a comfortable chair that helps a user to readily reach a good posture so that his/her body keeps the natural state wherein the spin position and the space between the vertebrae do not change and the muscles of the waist and back relax. Otherwise, when changing to an incorrect position, intervertebral discs are narrowed and ligaments are stressed causing pain and discomfort [7]. The correct chair selection si necessary to be taken int account the human height, for this reaseon it must be able to adjust in order to provide a support for the user’s lumbar region to be able to execute his task with comfort [7].
The selection is done of set of poses is highly dependent on the detection system design. Particularly, we set 4 poses detected through direct visualize method.
Once data are acquired by installed sensors inside the chair seat, we perform a data analysis stage using machine learning techniques. Such a stage involves a classification step using the well-known K-Nearest Neighbors (K-NN) multilabel classifier that depends of a metric used for the calculus of the Euclidian distance between two points for select the k neighbors nearest in terms of p attributes [11]. As well, due to the high dimension of acquired data (four dimensions) , we perform a DR step based on Principal Component Analysis (PCA) [8]. To implement our system, we opt by an Arduino platform because it is not only a powerful embedded system but is by construction highly versatile. In addition, there is a great amount of free code available at internet [9] [10] [12].
The electronic system proposed is aimed at detecting different poses that student may make during studying time. It works as follows: we use strength and ultrasonic sensors, which send the information to an embedded system. Such sensors are appropriately located and distributed on the chair.
The microprocessor inside the arduino does not have sufficient resources to storage big size of data and limited RAM memory for reading program, also the system is embedded to the chair and does not have communication for a computer. For this reason, we need to development a stages of machine learning.
To process the acquired data, we first apply PCA to represent the initial data –arranged into a data matrix – in lower-dimensional space [13]. Subsequently, we perform the KKN [14] [15] algorithm on the reduced data matrix. Doing so, we determine the poses that users (students) have made during a pre-established time period. To assess the accuracy of our system, we perform quantitative comparisons with a standard system running the same algorithms over the original higher-dimensional data matrix. As a result, regarding using the whole data set, the computational cost is decreased by 33 % as well as the data reading is reduced by 10 ms. Then, sitting-pose detection task takes 26 ms, and reaches 75% of accuracy in a 4-trial experiment.
The remaining of this paper is structured as follows: Section II, on one hand, presents the design of the electronic system and explains the data acquisition process. On the other hand, it outlines the data analysis made to detect sitting poses. Section III gathers the obtained results. Finally, Section IV draws the concluding remarks and future work.
2. Materials and Methods
The design of the Human Position detection in a chair system proposed in this work can be divided into two main stages: Acquisition and data analysis. An explaining diagram of the proposed system is shown in Figure 1.
2.1. Considered sitting poses and data settings
To establish the poses to be considered for our study, we use direct observation for setting the types of sitting made by a study group. The analysis is done over a University student group, who are monitored during their studying activities at library, as shown in Figure 2. As a conclusion, we find that there is a sitting pattern evidenced in 4 poses, similarly as proved in another study [16].
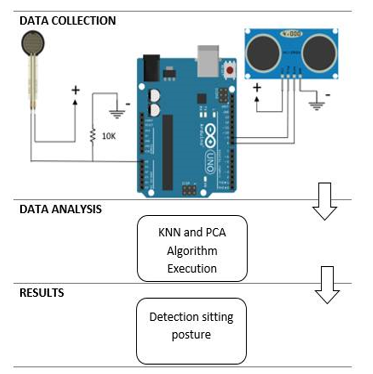
Figure 1. Explaining diagram of the proposed system. It mainly involves stages for data collection and analysis.
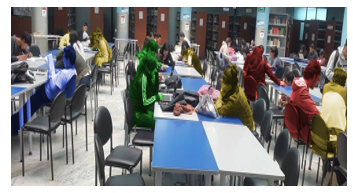
Figure 2. Sample picture of the student’s type of sitting. Four poses are determined: Upright (red), leaning forward without back support (yellow), bowed forward (green), and tilted backwards (blue)
Table I gathers the name and description of all the considered poses. Figure 1. Comparatively, Poses a) (in red) and c) (in green) are better than the remaining ones since they have lumbar support, preventing from extra loads on the intervertebral discs of the spine, while relaxing the hip and back muscles.
TABLE I. DESCRIPTION FOR THE POSITIONS
| # | Pose | Brief description |
| a) | Upright |
The back and thighs form an angle of 90◦.
|
| b) | Leaning forward without back support |
The lower back have no support. Slope of up to 40º.
|
| c) | Bowed forward |
It has lumbar support. Slope of up 40º.
|
| d) | Tilted backwards |
Upper back against the chair backrest. Relaxed.
|
Data are acquired from observing 7 students (4 men and 3 women). Each of them is monitored for a while and making the 4 considered poses depicted in Figure 3. Our system linearly picks samples over a period of 1 minute. The processor works at 16MHz with own clock.
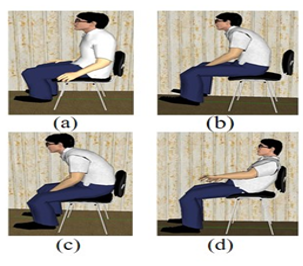
Figure 3. Sitting poses to be performed by the students from study group.
2.2. Electronic System Design
We design the circuit using as a main element the Arduino 1 R3 as embedded system. Three strength sensors (FSR-402) and one ultrasonic sensor (HCSR-05) are connected to Arduino through a transmission line that carries data while the user is sitting on strength sensors surface. Sensors are utilized as follows: Strength sensors are placed together on the chair being adapted inside the seat, while the ultrasonic sensor is placed on top of backrest as shown in Figure 4
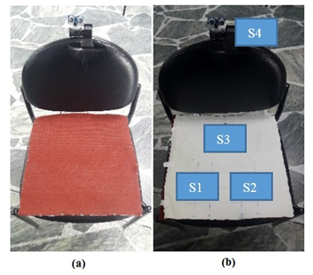
Figure 4. Sensor distribution on the chair. The figure shows the front (a) and backhand (b) view of fabric.
2.3. Data Analysis
The acquired data are arranged into a data matrix M (training set) which is m x n, where m is the number of samples or data points and n is the number of attributes or variables representing each data point. Initially, since 4 sensors are used, we get n = 400 and m = 4 for the higher-dimensional matrix M. Then, such a matrix is reduced by using PCA [10]. Particularly, we extract a new, 2-dimensional matrix. Over the reduced matrix, we run a K-NN classification algorithm. It depends on a metric used as a distance to measure how similar are the data points. Here we consider the Euclidean distance [11]. The data matrix N (test set) which is j x l, where j=100 and l=4.
Since strength sensors tend to be very sensitive, during data collection, the outliers must be clearly identified, especially those generated in the descent to the chair and sitting movements before establishing a fix sitting pose. We perform a manual outlier removal procedure. A total of 100 data points per position are considered for training the system. PCA is used to find the most relevant variables following a variance criterion. We obtain that sensors 3 and 4 represents the 86.66% of the data representation (see Figure 5). To perform the DR procedure, we set the resultant dimension as 2. So, we can draw 2D scatter plots as shown in Figure 6.
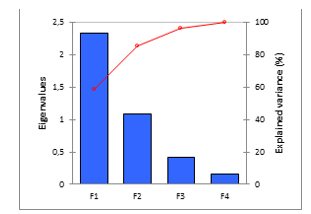
Figure 5. Eigenvalues bar diagram and explained variance plotting for the original higher-dimensional data matrix
The considered variables are those for the strength sensor S3 and proximity sensor S4. Another matrix size reduction should still be performed to prevent from saturating the RAM of the microcontroller [17] [18]. Following a K-NN scheme the number of rows (samples) can be reduced by excluding the data points being close from the average data distribution. Doing so, we get that the new number of rows becomes 80. Here we name the new, reduced matrix is named S that shows at the figure 6
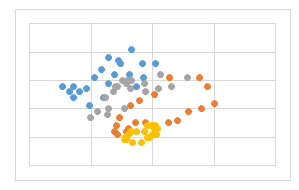
Figure 6. Scatter plot of reduced matrix. Each color represents one of the considered classes (poses) as follows: Pose 1 in blue, pose 2 in orange, pose 3 in gray and pose 4 in yellow.
The S matrix is stored in the embedded system RAM, in this way is faster the access to registers in relation to data EEPROM memory, but the CPU had overload when integrated all sensors and KNN algorithm. For this reason, we implemented a restart system after the electronic system has classified each five same times the user postures on the chair.
The flow diagram of the implemented approach is graphically described in Figure 7.
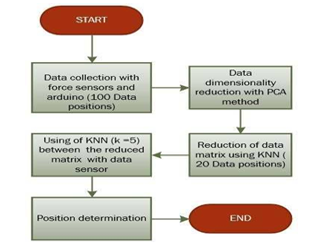
Figure 7. Flow diagram of the proposed data classification approach used for sitting-pose detection
The most important part in this work, is the embedded KNN algorithm inside an 8-bit microcontroller. After obtain the reduced matrix in 82 points with a position label, it necessary create a hexadecimal type file which must compilate in RAM memory. In the principal program, we call the file to read and compare each matrix’s point with new data acquired for the accelerometer sensor and determinate the shorter distance and predict the position with the matrix label. The picture 8 shows a pseudocode that describes the K-NN function implemented [19].
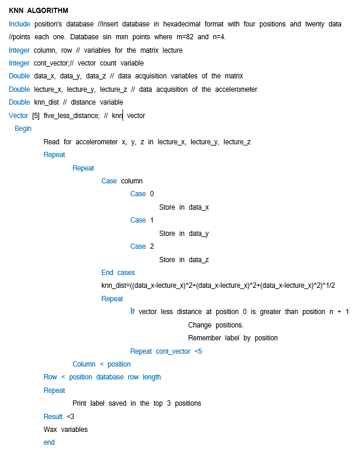
Figure 8. K-NN pseudocode write in C language
3. Results
The tests were conducted on both a standard computer (PC) and the proposed system. Ten data points per pose taken at random were tested considering the matrices N and S. The former matrix is only tested on the PC.
Results were obtained for all the analyzed poses a. Using matrix N, for pose 1, an average accuracy rate (AAC) of 72% success rate was reached. Likewise, for poses 2, 3 and 4 the AAC was 86%, 63% and 77%, respectively. Figure 9 shows the ACC boxplots. Given its simplicity, the system outcomes are comparable with those reported in literature. As a result, the rules for x and y to reduce the dimension were: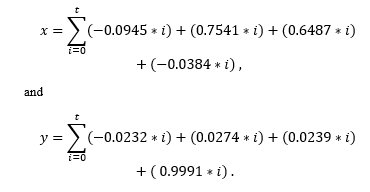
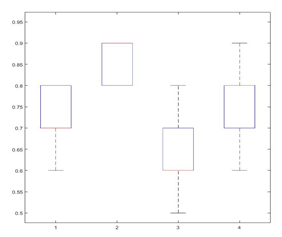
Figure 9. Boxplots of accuracy rate using matrix M
Using S, AAC is of 68% for pose 1, 83% for pose 1, 67% for pose 3 and 83% for pose 4. These results can be graphically appreciated in Figure 10.
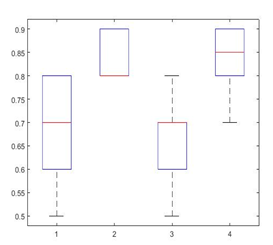
Figure 10. Boxplots of accuracy rate using matrix S.
Results regarding memory usage of the embedded system processor are significant good. When inputting the higher-dimensional matrix M 99% of the flash memory of 8Kbytes is used, and therefore there would not be enough space for typing more script lines. On the contrary, using the lower-dimensional matrix S, only the 30% of the memory is used, leaving enough to add lines of programming space. As a result, regarding using the whole data set, the computational cost is decreased by 33 % as well as the data reading time is reduced by 10 ms. Then, sitting-pose detection task takes 26 ms, and reaches 75% of accuracy in a 4-trial experiment.
4. Conclusions and Future Work
This work presents an alternative approach to deal with the problem of sitting-pose detection, which is based on a sensor network to acquire the position-related variables and machine learning techniques. Particularly, dimensionality reduction (DR) and classification techniques are considered. In this regard, both K-NN and PCA show to be suitable.
For future work, other issues are to studied such as real-time applications, computational load optimization and the use of different classification techniques to reach better performance.
- A. G. Costa y R. Fiorito, «Evaluación de posturas estáticas sedentes: Método del TEPmetro,» Santa Fe, Argentina, 2014.
- B. Mutlu, A. Krause, J. Forlizzi, C. Guestrin y J. Hodgins, «Robust, Low-Cost, Non-Intrusive Sensing and Recognition of Seated Postures,» de Research Showcase at CMU, 2007.
- D. Cohen, «An objective measure of seat comfort,» de Journal of Aviation, Space, and Environmental Medicine, 1998.
- M. Halender y L. Zhang, «Field studies of comfort and discomfort in sitting.,» Ergonomics, pp. 895-915, 1997.
- Y.-R. Huang y X.-F. Ouyang, «Sitting Posture Detecting And Recognition Using Force Sensor,» de International Conference on BioMedical Engineering and Informatics , Chongqing, 2012.
- M. Zhu, A. Martínez y H. Tan, «Template-based Recognition of Static Sitting Postures,» de Computer Vision and Pattern Recognition Workshop, Madison, Wisconsin, USA, 2003.
- Y. Mingjiu y Q. L. Changde, «Ergonomics Analysis for Sitting Posture and Chair,» International Conference on Computer Aided Industrial Desing and Conceptual Desing , vol. 7, pp. 1-4, 2007.
- L. Vilhena Martins, M. Santos, C. Quaresma y P. Vieira, «Intelligent Chair Sensor, Classification of Sitting Posture,» de Communications in Computer and Information Science, 2013.
- Q. Jiang y J. Shi, «Sparse kernel entropy component analysis for dimensionality reduction of neuroimaging data,» de 36th Annual International Conference of the IEEE Engineering in Medicine and Biology Society, Chicago, 2014.
- P. Gonzáles Martín, A. Diaz de Pascual, E. Torres lezama y E. Garnica Olmos, «Una Aplicación del Análisis de Componentes Principales en el Área Educativa,» Revista Económica Universidad de los Ándes Venezuela, vol. 26, pp. 1-18, 2012.
- R. Min, D. Stanley, Z. Yuan, A. Bonner y Z. Zhang, «A Deep Non-linear Feature Mapping for Large-Margin kNN Classification,» de Ninth IEEE International Conference on Data Mining, Miami, FL, 2009.
- P. Jamieson y J. Herdtner, «More missing the Boat — Arduino, Raspberry Pi, and small prototyping boards and engineering education needs them,» de Frontiers in Education Conference (FIE), El Paso, TX, 2015.
- M. P. y V. Stopjakova, «PCA Data Preprocessing for Neural Network-Based Detection of Parametric Detecs in Analog IC,» 2006 IEEE Desing and Diagnostics of Electronic Circuits and systems, nº 9007211, pp. 129 – 133, 2006.
- X. Hao, X. Tao, C. Zhang y Y. Hu, «An Effective Method To Improve kNN Text Classifier,» de Software Engineering, Artificial Intelligence, Networking, and Parallel/Distributed Computing, 2007. SNPD 2007. Eighth ACIS International Conference, Qingdao, 2007.
- Y. Komai , Y. Sasaki, T. Hara y S. Nishio, «A kNN Query Processing Method in Mobile Ad Hoc Networks,» de 2011 IEEE 12th International Conference on Mobile Data Management, Lulea, 2011.
- Y. Zheng y J. Morrell, «Comparison of Visual and Vibrotactile,» IEEE Transactions on Haptics, vol. 6, pp. 13-23, 2012.
- B. Qui, V. Prinet, E. Perrier y O. Monga, «Multi-block PCA method for image change detection,» de Image Analysis and Processing, 2003.Proceedings. 12th International Conference on, 2003.
- P. Dhillon, J. Gee, L. Ungar y B. Avants, «Anatomically-Constrained PCA for Image Parcellation,» de Pattern Recognition in Neuroimaging (PRNI), 2013 International Workshop on, Philadelphia, 2013.
- S. Nuñez-Godoy et al., “Human-sitting-pose detection using data classification and dimensionality reduction,” 2016 IEEE Ecuador Technical Chapters Meeting (ETCM), Guayaquil, 2016, pp. 1-5.