
Computational Intelligence Methods for Identifying Voltage Sag in Smart Grid
Volume 2, Issue 3, Page No 412-419, 2017
Author’s Name: Turgay Yalcina), Muammer Ozdemir
View Affiliations
Electrical & Electronic Engineering Faculty, Ondokuz Mayis University, 55139, Samsun, TURKEY
a)Author to whom correspondence should be addressed. E-mail: turgay.yalcin@omu.edu.tr
Adv. Sci. Technol. Eng. Syst. J. 2(3), 412-419 (2017); ![]() DOI: 10.25046/aj020353
DOI: 10.25046/aj020353
Keywords: C4.5 decision trees, Classification methods, Feature extraction, K-Means Clustering, Support vector machines , Voltage sag

Export Citations
In recent years pattern recognition of power quality (PQ) disturbances in smart grids has developed into crucial topic for system equipments and end-users. Undoubtedly analyzing the PQ disturbances develop and maintain smart grids effectiveness. Voltage sags are the most common events that affect power quality. These faults are also the most costly. This paper represents performance comparisons of different computer intelligence methods for voltage sag identification. PQube Analyzer which is installed in Ondokuz Mayis University Computer Laboratory for collecting real time disturbances data for each three phases in order to test for proposed algorithms. Firstly, we used Hilbert Huang Transform to genarate Instantaneous Amplitude (IA) feature signal. Then Characteristic features are attained from IA. The 4 features, mean, standard deviation, skewness, kurtosis of IA are calculated. Support Vector Machines (SVMs) and C4.5 Decision Tree methods are conducted for classification of the disturbance. Secondly we used Fishers Discriminant Ratio for selecting statistical features such as mean, standard deviation, skewness and kurtosis of the normal and voltage sag signals for this part K Means Clustering Method were performed for classification of the disturbance. Consecuently, SVMs, C4.5 Decision Tree and K Means Clustering Methods were performed also their achievements were matched for error rates and CPU timing
Received: 16 March 2017, Accepted: 11 May 2017, Published Online: 23 May 2017
1. Introduction
PQ problems occur due to frequency, voltage swells, voltage sags, light flicker, voltage transients, harmonics, unbalanced 3-phase signal. All equipments influence the grid by the reproduction harmonics, voltage variations. Also the performance of transformers and generators are affected by the power quality on the distribution network. Unanticipated alteration of the voltage and current signal from healthy conditions can devastate or stoppage the critical electrical machineries created for various aim [1-5].
1.1. Voltage sag
Voltage sags are short-duration (less than 1 second) reductions in voltage magnitude. The sag is mostly related with the short circuit faults single-line to ground, line to line, and for three-phase to ground faults. This type of disturbance is nowadays one of the main PQ disturbances. Momentary increase of current has many origins in power systems such as energizing of transformers, short circuits, earth faults and starting of induction motors. Voltage sags are the most typical disturbances that affect power quality in smart grids. Moreover, they are the most costly. When voltage sag happens, the power supply inside electronic devices uses some of its stored energy to make up for the failure of input voltage. If enough energy is lost owing to the sag, then the power supply may fail its task to maintain adequate
2. Material and Methods
DC voltage to components. Even for nanoseconds such integrated circuits, inside the device are affected by. This is very short moment to destroy data in microprocessor based electronics and to bring about malfunctions of digital equipment especially PCs. Malfunction of PCs integrated. in a real-time system is linked with conceivably bigger results, because there are losses correlate with the controlled process. The sensitivity of PCs to voltage sags is mostly expressed only in terms of the magnitude and duration of the voltage sag [25, 26, 30, 31, 40]. Considering previous studies about PQ disturbances analysis, Short-Time Fourier Transform (STFT) have been applied for stationary and periodic signals in frequency domains. But when handling non-stationary signals, it is problematic to analyze with STFT [47, 48, 49]. It was experimentally verified and demonstrated the WT is better than STFT [47]. Wavelets are employed in PQ when the time information is crucial however, it is not crucial to perceive the specific frequency of a fault in waveforms. Using WT, high time resolution is arranged for high- frequency components and low time resolution is attained for low-frequency components of the disturbance. Another method, ST is acquired by multiplying WT with a phase correction factor. This method’s disadvantage is having large computation time. Since ST is a Fourier-based technique, it also deteriorates from the handicaps of Fast Fourier Transform (FFT) [18, 20, 47, 48, 49]. On the other hand, the Hilbert Huang Transform (HHT), signals are extracted for different oscillation modes called intrinsic mode functions (IMFs). These functions are related to different time scales. Application of Hilbert transform to these IMFs can indicate the instantaneous amplitudes (IA) and the instantaneous frequencies (IF). Therefore, HHT can give a reasonably better time-frequency pattern representations for non-stationary signals [6, 11, 12, 13, 18, 19, 21]. In the light of this information, we used the HHT for generating IA signals from the voltage sag signal Firstly, for 3 phases (L1-N, L2-N, L3-N) real time processing the first intrinsic mode function is removed with the addition (superposition) of remain components to reconstruct the analyzed signal. Secondly, we generate features with the help of statistical functions such as mean, Standard deviation, skewness and kurtosis. For Diagnosis part we utilized Support Vector Machines, Decision Tree, and K Means Clustering Methods. These methods have performed also their achievements were matched for error rates and CPU timing.
2.1. Signal Processing Methods for Feature Generation
Unlike the traditional methods such as STFT (Short time fourier Transform), Wavelet Transform (WT) and Stockwell Transform (ST), Hilbert Huang Transform (HHT), especially for noise assisted PQ disturbances signals, provides better and useful representation in order to detect the disturbance. Disadvantages and advantages of signal processing methods for feature generation procedure summarized in Table I.
Table I. Comparison of feature extraction methods for PQ disturbances [11, 18, 21]
| Disadvantages | Advantages | |
| STFT |
Basis: Non-adaptive Completely Theoretical
Not acceptable for non-stationary signal as it does not follow signal oscillation accurately because of limitation of fixed window width |
Profitably handle for stationary signals where properties of signals do not derive in time. Quite simple in application. |
| WT |
Basis: Non-adaptive Completely Theoretical
Fully affected by noise present in the signal, adversity from spectral leakage effects |
Gives local illustration in both time and frequency. Thus, suitable good time– frequency resolution is appropriate. |
| ST |
Basis: Non-adaptive Completely Theoretical
Does not accomplish real-time requirement based on block processing, false harmonics measurement owing to dependency of frequency window width |
Maintain time and frequency representation. Good time-frequency resolution.
|
| HHT |
Limited for narrow band conditions Mode mixing and end effect problems |
Basis: Adaptive Empirical
Conveniently applicable to non-linear and non-stationary processes. Generates perpendicular IMFs whereby instantaneous amplitude and phase can be easily assessed be easily evaluated |
2.2. Stockwell transform (S- transform)
The S-transform is a time–frequency plane gadget produced by the mixture of wavelet and short time fourier transform It generates a time– frequency plane of a time series. It individually merges a frequency dependent resolution that contains the real and imaginary part of spectrum. Gaussian modulated co-sinusoids are the primary function for the S-transform [6, 7]. The Short Time Fourier Transform (STFT) of signal x(t) is explained in equation 1.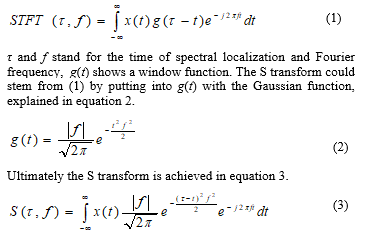
If the window of S transform is wider in time, it gives better frequency resolution for lower frequency. Whereas the window is narrower, it gives superior time resolution for higher frequency, namely trade-off between time and frequency resolution [18, 20].
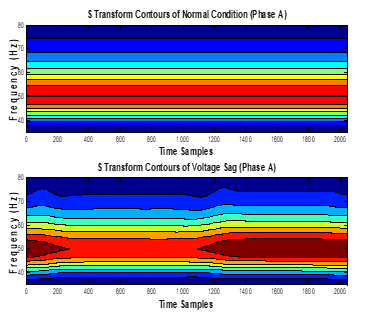
S-Transform is not capable of detecting noise as much as HHT in real time measurements [8, 32] (Figure 1). However, it is clearly shown that ST can produce valid features for detecting voltage sag.
2.3. Proposed Method: Hilbert Huang transform
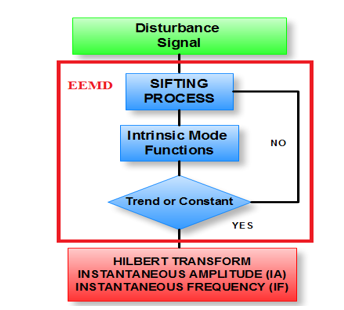
HHT, a self-adaptive signal-processing method, which has been applied in non-stationary signal-processing successfully, was developed by Huang. EMD method is a sifting iteration, to decompose one Intrinsic Mode Function (IMF) component needs many times sifting till obtaining last IMF, residual monotonic function [9, 10]. Main steps of HHT shown in figure 2.
The EMD [11, 12, 13] algorithm the steps:
Beginning of Sifting Process
- Find all maximas and minimas of the signal x(t).
- Attain the upper and lower envelope by the cubic spline interpolation.
- Find the mean function of the upper and lower envelope mean(t).
- Calculate the difference signal f(t) = x(t)−mean(t).
- When f(t) becomes a zero-mean process, then the iteration stops and f(t) is an Intrinsic Mode Function IMF1, c1(t); otherwise, go first step and replace x(t) with f(t).
- Calculate the residue signal res(t) = x(t)−c1(t).
Iterate the procedure from steps (i) to (vi) to obtain IMF2, named c2(t). To attain cn(t), continue steps (1) till step (6) after n iterations.
End of the Sifting Process
- The algorithm stops when the final residual signal res(t) becomes a monotonic function.
2.3.1 Ensemble EMD (EEMD) Algorithm
The major challenge of the EMD algorithm is the appearance of mode mixing. Therefore the EEMD algorithm was performed for overcoming the problem in this study [12, 13].
Analyzed signal is decomposed using the ensemble empirical mode decomposition (EEMD) into intrinsic mode function (IMF) that includes instantaneous frequencies (IF) and instantaneous amplitudes (IA). When the signal is turn into IMFs, the Hilbert transform can formerly be carried out to each IMF giving the IA and IF versus time plot. This merging of EEMD process and Hilbert transform is known as the HHT [6, 11, 12, 13, 18, 19, 21].
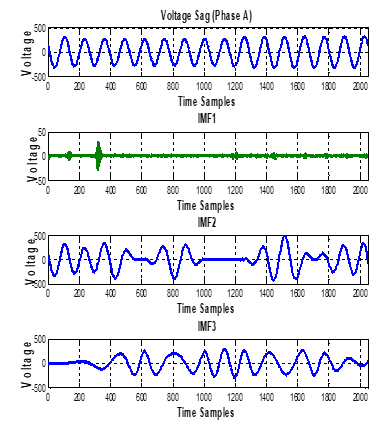
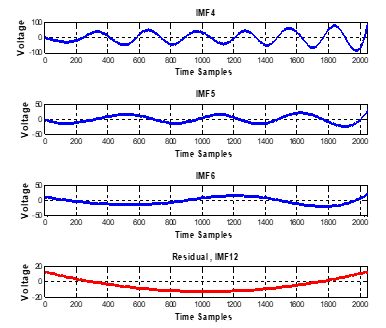
For 3 phases (L1-N, L2-N, L3-N) real time processing the first intrinsic mode function is removed with the addition (superposition) of remain components to reconstruct the analyzed signal. Fig 3 illustrates first component IMF1 the noise (lowest magnitude highest frequency signal) on the line (L1-N) to the lowest frequency component residual, last IMF12.
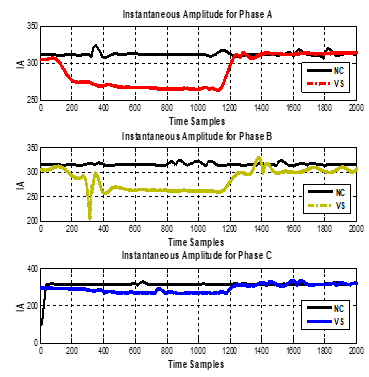
In figure 4, it is clearly shown voltage sag on two phases (L1-N, L2-N)
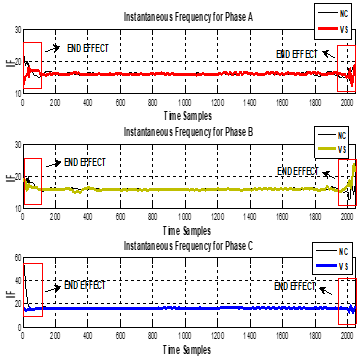
IF signal can be used for separation for two cases but there is end effect problem that has to be solved. When cubic spline fitting is computationally demanding, it generates distortions near the end points. This is a technical problem that causes data failures and peaks at the beginning and at the end of the signal. This fault will be investigated on Hilbert-Huang transform (Figure 5).
3. PQ Disturbances Computational Intelligence Methods
3.1. Support vector machine (SVM)
SVM methods, is developed by Vapnik, whereby statistical learning technique being the basis contributes a novel machine learning method. SVMs are linked supervised learning methods used for classification and regression. SVMs target obtaining optimal hyper-planes different classes of input data in a high dimensional feature space, thus new test data can be classified by acquired the hyper-planes Support vectors lie closest to the optimal hyper-plane [7, 14, 18, 21, 28, 34].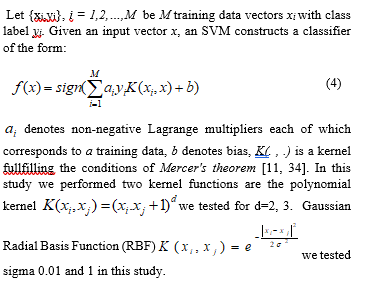
3.2. Decision Trees
Decision trees are methods that utilize divide-and-conquer approaches as structure learning by induction [15, 16]. The C4.5 algorithm was developed by Qinlan, contains the generation of a tree whereby a training set, finding the information gain criterion with the help of Shannon Entropy in order to find the finest attribute/feature to be used at each node.
3.2.1 Shannon Entropy
It is given a probability distribution D = (d1, d2,…, dm) the Information carried by this distribution entropy of D is explained in equation 5.
3.2.2 The Information Gain
The Information defines the gain for a test t and a position d![]()
that values (dj) is the set of all possible values for attribute t. Equation 5 can calculate highest ranking attributes and build the decision tree where at each node is located the attribute with the highest information gain. Furthermore, the algorithm applies the post pruning approach to diminish the size of the tree and prohibit over fitting. C4.5 is a technique for approximating discrete-valued functions that is powerful tool to noisy data and suitable for learning distinctive statements [16, 17, 18, 19, 20, 21, 28, 29].
3.3. K-Means Clustering
K-means clustering algorithm is a significant unsupervised classification technique to separation of set of dissimilar patterns. Same featured patterns are arranged into same clusters, different features are replaced in different sets [22, 23].The steps of the algorithm:
- Apply K points into the space illustrated by objects being clustered. These points symbolize first group centroids. Determine each object to the nearest centroid group.
- As objects have been completed, recalculate the localizations of the K centroids.
- Iterate Steps 1 and 2 until the centroids do not change anymore. This creates a separation of the objects into groups from which the metric with squared Euclidean distance objective function which is defined in equation 6, can be calculated.
The objective of this algorithm is to make an objective function, minimize the squared error function [35, 36, 37].
K denotes clusters Si, i = 1, 2,…, k, and is the mean points of centroids.
3.3.1 Fisher’s discriminant ratio (FDR)
FDR or SNR (in machine learning) is commonly performed to compute the inequitable way of specific features between two clusters. Linked with the values of a feature in two classes, 1 and 2 be the respective mean values and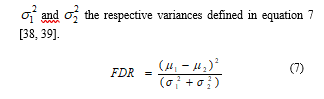
4. Experimental Set up and Discussions
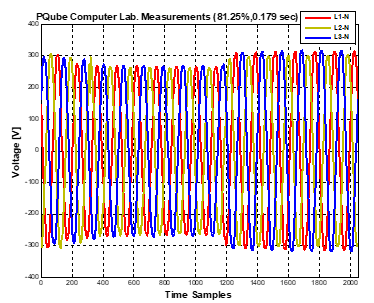
For experimental studies, we installed PQube Analyzer in Ondokuz Mayis University Computer Laboratory for collecting real time disturbances data for each three phases in order to test for proposed algorithms. 3 phases connected with totally 28 numbers of PC loads. PQube power meter installation properties explained in appendix of the paper. This paper includes computational intelligence methods in order to classify voltage sag disturbance. Figure 6 shows 3 phase voltage sag condition PQube sample measurements from Computer Laboratory in Ondokuz Mayis University including July 2016 to December 2016.
In this study, we apply two methods for identification of voltage sag. Selecting appropriate features of voltage sag events are highly crucial for diagnosing of the fault properly. Classification process of real-time voltage sag disturbances are shown in Figure 7.
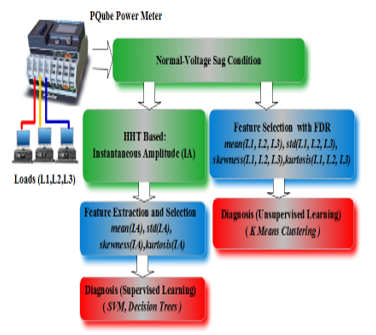
First Method, firstly extracted features are produced from ensemble empirical mode decomposition (EEMD) method so as to classify the voltage sags in grid. After reconstruction signal without noisy part, removing first intrinsic mode function (IMF). Then instantaneous amplitude (IA) is generated by means of HHT. The following features were extracted: mean, standard deviation, skewness function results of IA.
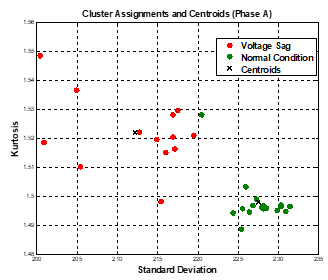
Second Method, we generated the statistical features from PQube 3 phase line voltages. In order to select the best feature from the functions, we performed Fisher Discriminant Ratio criteria. Selected features which give high ratio for Phase A and B are standart deviation and kurtosis, for phase C are mean and skewness. Then we used generated features for K Means Clustering Methods. Figure 8 shows selected features space and cluster assignments and centroids of normal and voltage sag condition sets.
|
Table II. Performances of disturbance diagnose algorithms
|
|||||||||||||||||||||||||||||||||||||||||||||||||||||||
To figure out the performance of the proposed power quality classification algorithm, a total number of 30 PQube Analyzer real time disturbances data were used 15 for normal conditions 15 for voltage sag conditions. The PQ signals are divided into two categories; 20 of them were used for training and 10 of them were used for testing the proposed algorithm with shuffling the data.
We analyzed for each three phases separately owing to main source connected with different loads (number of computers). This study is the first step of our work, second step will be searching relations with number of computers for each phases and fault percentage.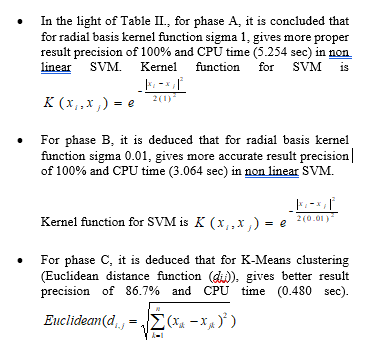
- It is clearly shown in Table II when examining each phases K- means clustering algorithm is the fastest algorithm.
- For phase A and B, SVM with RBF sigma=1 gives better results for detection voltage sag.
- For three phases, C4.5 decision tree gives same 80% recognition rate.
(Note: the most proper and robust classifiers for each phase are showed by Red font in Table II).
5. Conclusion
In this study, we aimed to generate non-time consuming features for detection voltage sag in smart grid. We also process and classify real time 3 phase voltage sag signals. In contrast to literature studies we do not normalize the features. Thus we can relate load types and fault magnitude and duration. Also it is processed real-time noise- assisted data. For this reason this study gives effective ideas about real time disturbance detection. As a result, SVMs, C4.5 Decision Tree and K Means Clustering Methods were performed also their achievements were matched for error rates and CPU timing. Simulations indicate that K- means clustering algorithm is the fastest algorithm. For phase A and B, SVM with RBF sigma=1 gives better result for detection voltage sag. Simulation results will be using for relation with loads types and the magnitude and duration of the voltage sag. Table III provides discussions about related signal processing methods such as WT, ST HT and for decision part SVM, DT, k-nearest neighbor (k-nn), Probability Neural Network (PNN). It also gives percentages error rates literature studies and the proposed methods. It is clearly shown in Table III most of the studies reported the results on synthetic normalized an done phase data which are absolutely far from real PQ disturbances. Apart from the previous studies, detection capability validates the potential of the proposed algorithm. To analyze the real time power signals and classification techniques were employed with Matlab ™ Toolboxes.
Table III. Performances of disturbance diagnose algorithms
| Reference | Methods for PQ Detection | Data types with Noise or Not ? | Error rate (ER)(%) |
| Eristri and Demir [41] | WT + SVM | Noisy data+Practical data | 4,19% |
| Xiao et al. [42] | ST + SVM | Without noise+Synthetic data | 7,70% |
| Samantaray [43] | ST + DT | Noisy data+Practical data | 2,44% |
| Hu et al. [44] | WT + SVM | Without noise+Synthetic data | 1,50% |
| Gargoom et al. [45] | HT + k-NN | Without noise+Synthetic data | 19,40% |
| Shukla et al. [46] | HT + PNN | Without noise+Synthetic data | 2,50% |
| Proposed Methods | *Table II |
Noisy data+Practical data (Not normalized data for each 3 phase measurements) |
*Table II |
Acknowledgment
This scientific study is supported by TUBITAK.
(Project Number: 114E919)
APPENDIX
Table IV. PQUBE MAINS VOLTAGE MEASURING CHANNELS [33]
|
||||||||||||||||||
- T. Yalcin, M. Ozdemir, “Pattern Recognition Method for Identifying Smart Grid Power Quality Disturbance”, IEEE PES ICHQP 2016, Belo Horizonte, Brazil,2016.
- RC Dugan, MF McGranaghan, HW Beaty. Electrical power systems quality. New York: McGraw-Hill, 1–38,1996.
- RA Flore. State of the art in the classification of power quality events, an overview. In: 10th international conference on harmonics and quality of power, vol. 1; p. 17–20,2002.
- M. H. J. Bollen and I. Y. H. Guo, Signal Processing of Power Quality Disturbances,New York: Wiley, 2006.
- P. F. Ribeiro, Duque. C.A, P. M. Silveria, and A. S. Cerqueira, eds., Power Systems Signal Processing for Smart Grids. Chichester, UK: John Wiley & Sons, Inc., 2013.
- J. C. Alfonso-Gil, S. Orts-Grau, N. Munoz-Galeano, F. J. Gimeno- Sales, S. Segui-Chilet, “Measurement system for a power quality improvement structure based on IEEE Std. 1459.”, IEEE Trans Instrum Meas;62(August (12)):3177–88, 2013.
- B. Biswal, PK. Dash, S. Mishra “A hybrid ant colony optimization technique for power signal pattern classification”, Expert Syst Appl, 38: 6368–75, 2011.
- M. Uyar, S. Yildirim, M.T.Gencoglu,, “An effective wavelet-based feature extraction method for classification of power quality disturbance signals”, Electr. Power Syst. Res, 78, (10), pp. 1747–1755, 2008.
- M. Inigo, L. Carlos, R. Jorge, G. Antonio, M. Jose, C. M. Juan, “Classification of electrical disturbances in real time using neural Networks”, IEEE Trans Power Deliv;22(7):1288–96, 2007.
- Standard definitions for the measurement of electric power quantities under sinusoidal, non-sinusoidal, balanced, or unbalanced conditions. Revision of IEEE Std. 1459-2000, IEEE Standard 1459-2010; March 2010.
- O. Ozgonenel, T. Yalcin, I. Guney, U. Kurt, “A New Classification for Power Quality Events in Distribution System”, Electric Power System Research (EPSR), 95, 192-199, 2013.
- Z. Wu, N.E. Huang,“A study of the characteristics of white noise using the Empirical Mode Decomposition method” ,Proc. Roy. Soc. London A. 2002.
- Z. Wu, N.E. Huang, “Ensemble empirical mode decomposition: a noise-assisted data analysis method. Adv. Adapt. Data. Anal. 1, 1–41, 2009.
- K. K. Hoong, S. P. Lam, C. Y. Chung, “An output regulation based unified power quality conditioner with Kalman filters”, IEEE Trans Ind Electron;59(November (11)):4248–62, 2012.
- I. H. Witten and E. Frank, Data Mining: PraticalMachine Learning Tools and Techniques. San Mateo, CA, USA: Morgan Kaufmann, 2005.
- M. T. Hagan and M. B. Menhaj, “Training feedforward networks with the Marquardt algorithm,” IEEE Trans. Neural Netw., vol. 5, no. 6, pp. 989– 993, Nov. 1994.
- R. J. Quinlan, C4.5: Programs for Machine Learning, vol. 1. San Mateo, CA, USA: Morgan Kaufmann, 1993.
- S. Mishra, T. Nagwani, “A Review on Detection and Classification Methods for Power Quality Disturbances” Volume 6, Issue No. 3, International Journal of Engineering Science and Computing, March 2016.
- A. S. F. Borges, A. S. R. Fernandes, N. I. Silva, B. S. C. Silva, “Feature Extraction and Power QualityDisturbances Classification Using Smart Meters Signals”, IEEE Transactions on Industrial Informatics, Vol. 12, No. 2, April 2016.
- O. Ozgonenel, D. W. P. Thomas, and T. Yalcin, “Superiority of decision tree classifier on complicated cases for power system protection,” in 11th International Conference on Developments in Power Systems Protection, pp. 134–134, Birmingham, UK, 2012.
- O. P.Mahela, A. G. Shaik, N. Gupta , “A critical review of detection and classification of power quality events”, Renewable and Sustainable Energy Reviews Volume 41, Pages 495–505, January 2015.
- J.M. Pena, J.A. Lozano,P. Larranaga, “An empirical comparison of four initialization methods for the k-means algorithm”, Pattern Recognition Lett. 20 (10), 1027–1040,1999.
- St. Douglas, J. B. Michael, “Initializing K-means Batch Clustering: A Critical Evaluation of Several Techniques”, Journal of Classification 24 (1), 99-121, 2007.
- T. Sergios, K. Konstantinos, Introduction to Pattern Recognition, 4th edition, Academic Press, 2009.
- M. Kezunovic, Y. Liao, “A new method for classification and characterization of voltage sags”Electric Power Systems Research;58(1):27–35, 2001.
- V. Ignatova, P. Granjon, S. Bacha, “Space vector method for voltage dips and swells analysis”, IEEE Transactions on Power Delivery;24(4):2054–61, 2009.
- PK. Dash, BK. Panigrahi, G. Panda, “Power quality analysis using s-transform”. IEEE Transactions on Power Delivery;18(2):406–11, 2003.
- SR. Samantaray, “Decision tree-initialised fuzzy rule-based approach for power quality events classification”. IET Generation Transmission & Distribution;4(4):538–51, 2010.
- IWC Lee, PK. Dash, “S-transform-based intelligent system for classification of power quality disturbance signals”. IEEE Transactions on Industrial Electronics ;50(4):800–5, 2003.
- MHJ. Bollen, What is power quality? Electric Power Systems Research ;66(1):5–14, 2003.
- MHJ. Bollen, E. Styvaktakis, IYH. Gu, “Categorization and analysis of power system transients”, IEEE Transactions on Power Delivery;20(3):2298–306, 2005.
- S. Mishra, CN. Bhende, BK. Panigrahi, “Detection and classification of power quality disturbances using s-transform and probabilistic neural network”, IEEE Transactions on Power Delivery;23(1),pp.280–287, 2008.
- PQube® Installation & User’s Manual, Firmware Rev 2.1, July 2012.
- V. N. Vapnik, Statistical Learning theory, Wiley, New York, 1998.
- C. Zhang, S. Xia, “ K-means Clustering Algorithm with Improved Initial center,” in Second International Workshop on Knowledge Discovery and Data Mining (WKDD), pp. 790-792, 2009.
- T. Kanungo, D. M. Mount, N. S. Netanyahu, C. D. Piatko, R. Silverman, A. Y. Wu, “An Efficient k-Means Clustering Algorithm: Analysis and Implementation”, IEEE TRANSACTIONS ON PATTERN ANALYSIS AND MACHINE INTELLIGENCE, VOL. 24, NO. 7, JULY, pp.881-892, 2002.
- J. Dong, M. Qi. “K-means Optimization Algorithm for Solving Clustering Problem. Knowledge Discovery and Data Mining”, pp.52-55, 2009.
- R. O. Duda, P. E. Hart, D. G. Stork, Pattern Classification, 2nd Edition, Wiley, Newyork, 2001.
- T. Sergios, K. Konstantinos, Introduction to Pattern Recognition, 4th edition, Academic Press, 2009.
- S. Ž. Djokic´, J. Desmet, , G. Vanalme, J. V. Milanovic´, K. Stockman, “Sensitivity of Personal Computers to Voltage Sags and Short Interruptions”, IEEE TRANSACTIONS ON POWER DELIVERY, VOL. 20, NO. 1, JANUARY,pp 375-383, 2005.
- H. Eristi, Y. Demir, “A new algorithm for automatic classification of power quality events based on wavelet transform and Svm”, Expert Systems With Applications, 37(6):4094–102, 2010.
- X. Xiao, F. Xu, H. Yang, “Short duration disturbance classifying based on stransform maximum similarity”, International Journal of Electrical Power and Energy Systems,31(7-8):374–8, 2009.
- SR. Samantaray, “Decision tree-initialised fuzzy rule-based approach for power quality events classification”, IET Generation Transmission & Distribution, 4(4):538–51, 2010.
- G-S. Hu, F-F. Zhu, Z. Ren, “Power quality disturbance identification using wavelet packet energy entropy and weighted support vector machines”, Expert Systems With Applications 2008;35(1-2):143–9, 2008.
- AM. Gargoom, N. Ertugrul, WL. Soong, “Investigation of effective automatic recognition systems of power quality events”, IEEE Transactions on Power Delivery, 22(4):2319–26, 2007.
- S. Shukla, S. Mishra, B. Singh, “Empirical-mode decomposition with Hilbert transform for power-quality assessment”, IEEE Transactions on Power Delivery, 24(4):2159–65, 2009.
- IYH. Gu, MHJ. Bollen, Time-frequency and time-scale domain analysis of voltage disturbances. IEEE Transactions on Power Delivery,15(4):1279–84, 2000.
- PS. Addison, The Illustrated Wavelet Transform Handbook. Institute of Physics, 2002.
- F. Jurado, N. Acero, B. Ogayar. “Application of signal processing tools for powerquality analysis”, IEEE Canadian Conference on Electrical & Computer Engineering, 1:82–7, 2002.