Validity of Mind Monitoring System as a Mental Health Indicator using Voice
Validity of Mind Monitoring System as a Mental Health Indicator using Voice
Volume 2, Issue 3, Page No 338-344, 2017
Author’s Name: Naoki Hagiwaraa), Yasuhiro Omiya1, Shuji Shinohara2, Mitsuteru Nakamura2, Masakazu Higuchi2, Shunji Mitsuyoshi2, Hideo Yasunaga3, Shinichi Tokuno2
View Affiliations
1Research and Product Development, PST Inc., 231-0023, Japan
2Verbal Analysis of Pathophysiology Graduate School of Medicine, The University of Tokyo, 113-0033, Japan
3Department of Clinical Epidemiology & Health Economics School of Public Health, The University of Tokyo, 113-0033, Japan
a)Author to whom correspondence should be addressed. E-mail: hagiwara@medical-pst.com
Adv. Sci. Technol. Eng. Syst. J. 2(3), 338-344 (2017); ![]() DOI: 10.25046/aj020343
DOI: 10.25046/aj020343
Keywords: Voice analysis, Mental health care, Mobile phone

Export Citations
We have been developing a method of evaluating the mental health condition of a person based on the sound of their voice. Currently, we have applied this technology to create a smartphone application that shows the vitality and the mental activity as mental health condition indices. Using voice to measure one’s mental health condition is a non-invasive method. Moreover, this application can be used continually through a smartphone call. Unlike a periodic checkup every year, it could be used for monitoring on a daily basis. The purpose of this study is to compare the vitality index to the widely used Beck depression inventory (BDI) and to evaluate its validity. This experiment was conducted at the Center of Innovation Program of the University of Tokyo with 50 employees of one corporation as participants between early December 2015 and early February 2016. Each participant was given a smartphone with our application that recorded his/her voice automatically during calls. In addition, the participants had to read and record a fixed phrase daily. The BDI test was conducted at the beginning of the experimental period. The vitality index was calculated based on the voice data collected during the first two weeks of the experiment and was considered as the vitality index at the time when the BDI test was conducted. When the vitality and the mental activity indicators were compared to BDI score, we found that there was a negative correlation between the BDI score and these indices. Additionally, these indices were a useful method to discriminate a participant of high risk of disease with a high BDI score. And the mental activity index shows a higher performance than the vitality index.
Received: 06 April 2017, Accepted: 28 April 2017, Published Online: 17 May 2017
1. Introduction
This paper is an extension of the work originally presented in IEEE BIBE 2016 (The 16th International Conference on Bioinformatics and Bioengineering) [1].
Currently, self-report type psychometric tests such as general health questionnaires (GHQ) [4] and Beck depression inventory (BDI) [5, 6] are used as methods of screening patients with mental health disorders. Besides these tests, there are proposals to use biomarkers such as saliva [7] and blood [8] as a method of evaluating mental health conditions. However, although self-report psychometric tests are effective in determining those conditions at their early stages and in complementing diagnoses, there are issues of reporting biases. A reporting bias refers to the effect of an undervaluation or overvaluation because of the consciousness or unconsciousness of subjects. It has been reported that the detection rate decreases in organizations that have established hierarchies such as in fire-fighting, police, or military [6-8]. Some causes of undervaluation in self-administered screenings are prejudice, discrimination, resistance to mental health disorder, or anxiety on career disadvantage in the job [6]. Concerning evaluations with biomarkers, they are a burden to those being tested as they are invasive, and the tests cost money. Thus, they cannot be considered as easy or simple solutions. In addition, conventional screening methods such as self-report psychometric tests and biomarkers are often conducted during a routine annual checkup, making it difficult to provide care during middle periods.In recent years, mental health disorders have become an issue in many developed countries and the cost of dealing with such disorders is enormous [2, 3]. There is a need for a screening technology that allows for a quick and easy way to detect depression and stress early to tackle these problems.
On the other hand, prior to this current research, the authors of this paper have been researching and working on a way to estimate the state of a person’s mental health as in their state of depression or stress through voice data [14, 15]. Using voice for analysis has the advantage of being not only non-invasive, but also not requiring any dedicated and specialized equipment; it is simple, easy, and can be done remotely. Using this technology to assess the state of one’s mental health condition through his or her voice can make it possible to achieve monitoring on a daily basis, which is difficult with conventional methods.
The authors have developed and provided MIMOSYS (mind monitoring system) SDK that estimates the health condition of speakers through their voice. MIMOSYS SDK has a function of recording and analyzing voice from a microphone as input and outputs the index of health condition as a result (see section 2.2). To allow daily monitoring for many people, we have developed a smartphone application using MIMOSYS SDK [16, 17]. The purpose of this study is to compare the vitality score, which is collected and analyzed through MIMOSYS to the BDI and evaluate its validity.
2. Materials and Methods
2.1. The Experiment
The experiment was conducted as part of the University of Tokyo, Center of Innovation Program. With the support of Kanagawa Prefectural government, we provided smartphones with preinstalled application to 50 employees of a company. This company is searching for health care measures and has recruited 50 in-house participants who are interested in the experiment. The 50 participants comprise 39 males and 11 females. The breakdown of age is shown in Figure 1. The model name and Android version of the smartphones used in the experiment are given in Table 1. We required the test participants to record their voice for two months through reading out fixed phrases and through talking using the smartphone provided.
We conducted the BDI test at the beginning of the experiment. The application detects when a call is made or received and automatically records the voice and analyzes it. The fixed phrases that the test participants read out daily are listed in Table 2. The application will erase the recorded voice file after the analysis, but the analysis results and user information are sent over a network to be collected and stored into a database. All the analysis results were obtained via this database.
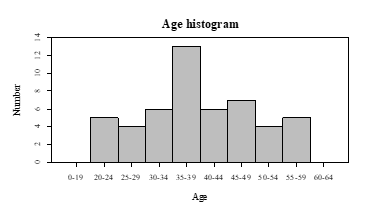
Figure 1. Age histogram of test participants.
Table 1. Model name of smartphones used in the experiment.
| Model | Number | Android version |
| SC-01F | 31 | 4.4.2 |
| SC-01F | 3 | 5.0 |
| SC-02E | 5 | 4.3 |
| SO-01E | 3 | 4.1.2 |
| SO-04F | 3 | 4.4.2 |
| SH-04F | 3 | 4.4.2 |
| F-05F | 2 | 4.4.2 |
Table 2. Manuscript of phrases read by participants.
| No. | Phrase (in Japanese) | Purpose |
| 1 | I-ro-ha-ni-ho-he-to. | non-emotional |
| 2 | Honjitsu ha seiten nari. | non-emotional |
| 3 | Tsurezurenaru mama ni. | non-emotional |
| 4 | Wagahai ha neko dearu. | non-emotional |
| 5 | Mukashi mukashi aru tokoro ni. | non-emotional |
| 6 | Omoeba tooku he kita monda. | non-emotional |
| 7 | a-i-u-e-o | check pronunciation |
| 8 | Ga-gi-gu-ge-go | check pronunciation |
| 9 | Ra-ri-ru-re-ro | check pronunciation |
| 10 | Pa-pi-pu-pe-po | check pronunciation |
| 11 | Garapagosu shotou | check pronunciation |
| 12 | Tsukarete guttari shiteimasu. | emotional |
| 13 | Totemo genki desu. | emotional |
| 14 | Kinou ha yoku nemuremashita. | emotional |
| 15 | Shokuyoku ga arimasu. | emotional |
| 16 | Okorippoi desu. | emotional |
| 17 | Kokoroga odayaka desu. | emotional |
1.1. MIMOSYS
In mental health disorders, a decrease in emotional expression appears and the proportion of sorrow component may increase. Therefore, MIMOSYS estimates the health condition of a speaker focusing on the balance and variation of these emotional indices. MIMOSYS is based on an emotion index obtained by a sensibility technology (ST) [9-11, 18]. It is preferable that natural utterance is inputted, although it is barely affected with utterance by acting. Therefore, in the developed application, we use the voice of calls that can be uttered naturally without consciousness for the analysis. We thought that it is advantageous to continuously use the call voice as an analysis target and accumulate the result.
In emotional recognition using ST, multiple feature quantities are calculated from the input voice, and four emotional components – anger (Ang), sorrow (Srw), joy (Joy), and calmness (Clm) – in the voice are calculated from these features. The degree of excitement (Exc) is also calculated. Thus, five indicators are outputted. MIMOSYS calculates two intermediate feature quantities, namely vivacity and relaxation, from these emotional indexes in internal processing. It calculates vivacity from Joy and Srw, and relaxation from Clm and Ang respectively. From there, a short-term health index, called vitality index, is calculated. Then, a medium-term health index, called mental activity, is calculated from the vitality index accumulated for two weeks. The data calculation flow is shown in Figure 2.
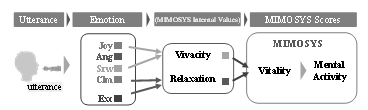
Figure 2. Data calculation flow of MIMOSYS.
Next, we will describe the implementation of the application. When analyzing using ST, it is necessary to input the voice by one utterance, and when analyzing a long voice, it is necessary to divide it into data of one utterance by detecting speech. Here, utterance is a voice uttered in a single breath. The smartphone application, MIMOSYS, implements speech detection to record and analyze a call voice. Specifically, the utterance part is detected by the volume level, and only the extracted utterance part is used for the analysis in ST. Then, an analysis of the health condition estimation is carried out with multiple utterances in one call as one set. The vitality index is outputted as a short-term health condition index from these sets of uttered voices. In addition, in order to suppress variations at individual recording timings and capture long-term trends, we outputted the medium-term health condition index, i.e., the mental activity index, calculated based on the vitality index accumulated for two weeks.
Both indicators for short term (vitality index) and medium term (mental activity) are each outputted as a real number value from 0.0 to 1.0. In addition, having both the recording and processing function on the smartphone eliminates the transfer cost of the recorded voice data that would otherwise be incurred had the recordings been performed on a separate recording device requiring a transfer to another computational device. Furthermore, considering the possibilities of information leaks from the voice recordings and to reduce the storage load, we have decided to delete the voice recordings after analysis. The results of the analysis were stored on the smartphone devices and also sent to a database server via the network for storage. As an index corresponding to the BDI test, the vitality index was calculated from the first recorded voice, and the mental activity was calculated from the voice recorded in the first two weeks.
2.3. Recording and Analyzing the Voice
There are two ways of obtaining the voice over the smartphone: the voice of the user reading some sentences (hereinafter referred to as fixed phrase recordings) and the voice while talking on the phone (hereinafter referred to as call recordings). To monitor by oneself on a daily basis, we speculate that call recordings, in which the caller is not conscious of the recording, would be more suitable. However, as there are differences in the frequency in which individuals use their phone for talking, we included in the analyzing application a function to record a fixed phrase reading on a regular basis for the experiment. In call recordings, the analysis was performed with utterances in one call; however, for fixed phrase recordings, the analysis was performed with utterances of reading the 17 phrases. Additionally, as there may be a difference in the nature of the voice between the fixed phrase recordings and call recordings that were obtained, to make it easier to differentiate them, information on which method was used to obtain the recordings was also included.
The voice to be analyzed was acquired by a microphone of the smartphone provided to the experiment participants (see Table 1). The recording format was a linear pulse-code modulation, the sampling frequency was 11,025 Hz, and the quantization bit rate was set at 16 bits. However, the recorded sound file was deleted immediately after the analysis was completed, and it was not taken out of the smartphone.
2.4. Beck’s Depression Inventory
The BDI test is widely used for judgment of depression, and the scores for judgment are listed in Table 3. In this research, a score of 18 or less is considered as low risk of disease, and more than that value is treated as high risk of disease. We conducted a test to evaluate the performance of the application to determine if the voices of the test participants could be used to discriminate between high risk of disease and low risk of disease. The BDI test was incorporated into the application and was executed when the application was first launched at the start of the experimental period.
Table 3. Categories for BDI score.
| BDI score | Categories of depression | Judgment |
| 0–9 | None to minimal depression | Low risk of disease ( ≤ 18) |
| 10–18 | Mild to moderate depression | |
| 19–29 | Moderate to severe depression |
High risk of disease ( > 18) |
| 30–63 | Severe depression |
2.5. Statistical Analysis of Data
The analysis result of the application is outputted to the csv (comma-separated values) file. We used Microsoft Excel functions and analysis tools to tally and analyze the data. Additionally, we analyzed the data and created diagrams using the R language.
3. Results
The analysis result was obtained from the 50 participants, and 48 valid results were obtained. In total, there were 890 call recordings and 4,357 fixed phrase recordings. The daily total recording count of the test participants in first two weeks is shown in Figure 3.
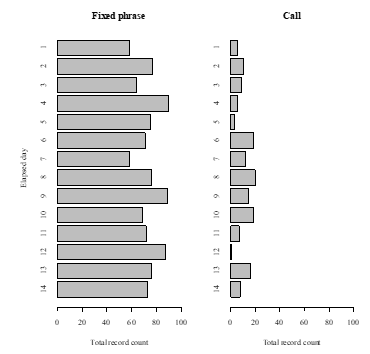
Figure 3. Total recording count of test participants with two methods.
3.1. Effect of the Recording Method
In the experiment, there were two methods in which the voice was recorded and obtained. For each method, we separately tallied the vitality index and the side of the vitality score that shows the short-term mental health condition. The average and standard deviation of the vitality index are given in Table 4.
Compared to call recordings, fixed phrase recordings tended to show a lower value and are less consistent. In this research, we evaluated the fixed phrase recordings and phone conversations independently.
Table 4. Average and standard deviation of vitality index by two recording methods.
| Call | Fixed phrase | |
| Average | 0.554 | 0.460 |
| Standard deviation | 0.0759 | 0.0981 |
3.2. Correlation to BDI
The scatter plot of the vitality index by fixed phrase recordings and the BDI score is shown in Figure 4. The correlation coefficient between the vitality index and the BDI score showed a negative correlation value of 0.208. Furthermore, the correlation between the mental activity index by the fixed phrase recordings and the BDI score is shown in Figure 5. The correlation coefficient between the mental activity and the BDI score showed a negative correlation value of 0.285.
The mental activity index, which is the medium-term indicator of the mental health condition, was calculated based on the voice data collected within the first two weeks, which was considered as the mental activity index at the time of the BDI testing. We found that depending on the test participants, there were differences on how often the phone was used. Because some had too few recordings captured or none at all, there were cases when we were unable to calculate the mental activity index corresponding to the BDI. Therefore, we were able to acquire call recordings from only 17 participants, which were used to calculate their mental activity index.
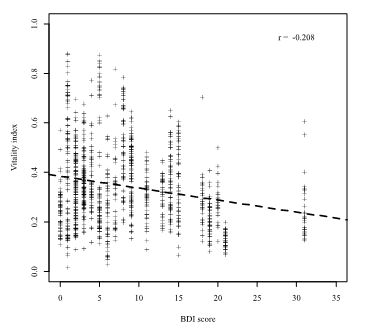
Figure 4. Scatter plot of BDI score and vitality by fixed phrase. The regression line is drawn in dashed line.
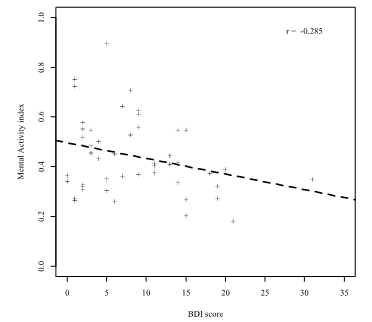
Figure 5. Scatter plot of BDI score and mental activity by fixed phrase. The regression line is drawn in dashed line.
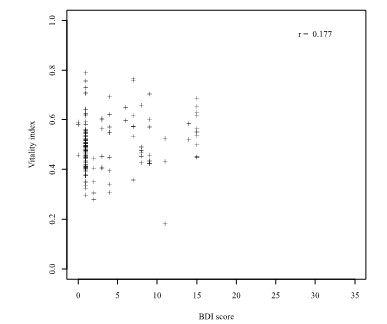
Figure 6. Scatter plot of BDI score and vitality by call.
The vitality index by call recording and its correlation to the BDI score is shown in Figure 6. The correlation coefficient between the vitality index and the BDI score was 0.177, which means that there is almost no correlation between the two. The mental activity index by call recordings and its correlation to the BDI score is shown in Figure 7.
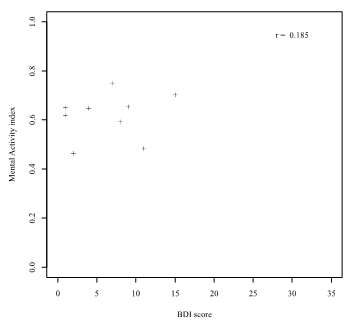
Figure 7. Scatter plot of BDI score and mental activity by call.
The correlation coefficient between the mental activity index by call recording and the BDI score was 0.185, which indicate that there is almost no correlation between the two.
The box and whisker plot is shown in Figure 8 and Figure 9. The results show that both scores showed a significant difference. However, the vitality index overlap of distribution is wider than that of the mental activity index.
3.3. Discrimination Evaluation of High Disease Risk using MIMOSYS
We then changed our perspective and evaluated the performance of discriminating high risk of disease and low risk of disease using the MIMOSYS index. However, the 17 participants with calculated mental activity from the call recordings all had a BDI score of less than 18; therefore, this evaluation was limited to using the fixed phrase recordings. With sensitivity as the vertical axis and 1-specificity as the horizontal axis, the receiver operating characteristic (ROC) curve plotted by changing the threshold is shown in Figure 10 and Figure 11. The ROC curve uses the area under the curve (AUC) as an indicator for performance evaluation. An AUC value in the range of 0.5–0.7 denotes low accuracy, 0.7–0.9 denotes moderate accuracy, and 0.9–1.0 denotes high accuracy.
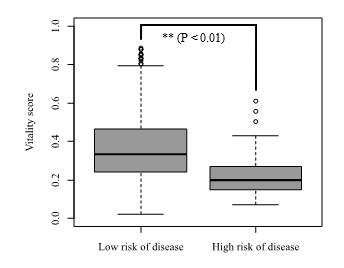
Figure 8. Box and whisker plot of vitality score by fixed phrase with low risk of disease and high risk of disease.
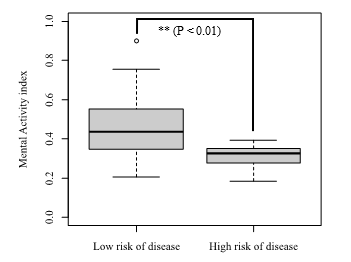
Figure 9. Box and whisker plot of mental activity score by fixed phrase with low risk of disease and high risk of disease.
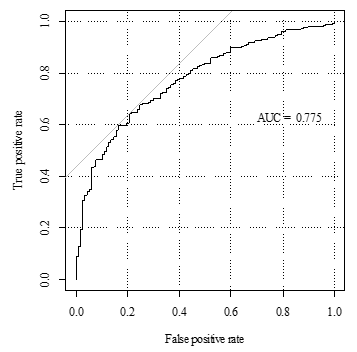
Figure 10. ROC curve used in discriminating between low and high risk of disease using vitality index.
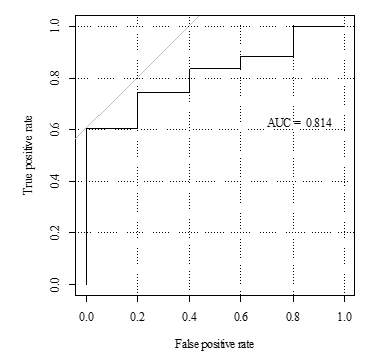
Figure 11. ROC curve used in discriminating between low and high risk of disease using mental activity index.
In the vitality index, the AUC was 0.775, while in the mental activity index, the AUC was 0.814. A well-balanced cutoff can be made at the point closest to the upper left corner in the ROC curve. Figure 12 and Figure 13 show the discriminated counts for the sensitivity, specificity, and accuracy at this point. Sensitivity, specificity, and accuracy are defined as follows:
Sensitivity = True Positive / (True Positive + False Negative)
Specificity = True Negative / (False Positive + True Negative)
Accuracy = (True Positive + True Negative) / Total Count
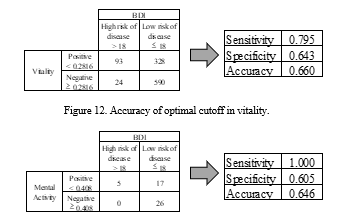
Figure 13. Accuracy of optimal cutoff in mental activity.
4. Discussion
4.1. Effect of the Recording Method
As a result of comparing the vitality index obtained by analyzing the fixed phrase and the call respectively, the fixed phrase tended to have a lower value and the standard deviation was also different. As the calculation of the voice indicator is based on the change in emotion, it is likely that the act of reading a fixed phrase would call for a lesser variation in emotional expression compared to phone conversations. For further consideration, we would like to determine if these differences such as the average and the standard deviation based on the recording methods could be corrected by, for example, changing or converting the values. This is for future research.
4.2. Correlation to BDI
In the fixed phrase recording, the vitality index and mental activity index both had a weak negative correlation to BDI. In addition, a higher correlation was found in the mental activity index. These results indicate that the higher the vitality index or mental activity index, the healthier the individual, and the lower the BDI score. On the other hand, the lower the indices of MIMOSYS, the worse the mental health condition and the higher the BDI. Hence, we consider such negative correlation between the two as actually a valid result.
As for the vitality index of the two classes separated by the BDI score shown by the box and whisker plot, a t-test shows a significant difference when observing the result of the fixed phrase recording, and the reasonable performance as a classifier can be expected. Moreover, the overlapping of boxes is smaller in the mental activity index than in the vitality index, and a higher discrimination ability can be expected.
On the other hand, some participants who made call recordings did not include those belonging to a class with a high disease risk with a BDI score greater than 18in the classification based on the BDI score. Therefore, in call recordings, we were unable to evaluate the discrimination of high disease risk. This is presumably due to the fact that the number of participants was limited, and those test participants we obtained had low BDI scores, thus skewing the samples.
4.3. Discrimination Evaluation of High Disease Risk using MIMOSYS
As for the discrimination of the high disease risk mentioned in the previous section, the result of evaluation by AUC was 0.775 for the vitality index and 0.814 for the mental activity index. We can say that this application has a moderate ability in discriminating the state of mental health. It shows that the mental activity index has a higher performance than the vitality index. In addition, the accuracy of the mental activity index was also shown to be similar to the vitality index as well.
5. Conclusion
In this research, we conducted an experiment to compare BDI to the vitality score, which was collected and analyzed through MIMOSYS, a smartphone application and a system we developed to use voice as a way of monitoring one’s mental health condition. We found that the vitality score had a significant correlation to BDI. Additionally, by its performance in discriminating a person who scored high in the BDI test, we were able to confirm its validity. In addition, the mental activity as a medium-term health index has a higher discrimination ability than the vitality as a short-term health index, indicating that data accumulation is effective. The results thus indicated that this system could be used as a daily monitoring system to supplement the routine checkup. At the same time, as the different recording methods showed a difference in their numerical values, the next challenge would be to eliminate this difference.
Conflict of Interest
The authors declare no conflict of interest.
Acknowledgment
This research is (partially) supported by the Center of Innovation Program from Japan Science and Technology Agency. I received generous support in gathering the experiment participants from Kanagawa Prefectural government.
- R. C. Kessler, H. S. Akiskal, M. Ames, H. Birnbaum, P. Greenberg, R. M. A. Hirschfeld, R. Jin, K. R. Merikangas, G. E. Simon, P. S. Wang, “Prevalence and effects of mood disorders on work performance in a nationally representative sample of U.S. workers” Am. J. Psychiat., 163, 1561–1568, 2006.
- World Health Organization, The Global Burden of Disease: 2004 Update, WHO Press, Geneva, Switzerland, 46–49, 2004.
- A. T. Beck, C. H. Ward, M. Mendelson, J. Mock, J. Erbaugh, “An inventory for measuring depression” Arch. Gen. Psychiat., 4, 561–571, 1961.
- A. T. Beck, R. A. Steer, M. G. Carbin, “Psychometric properties of the Beck depression inventory twenty-five years of evaluation” Clin. Psych. Rev., 8, 77–100, 1988.
- S. Izawa, N. Sugaya, K. Shirotsuki, K. C. Yamada, N. Ogawa, Y. Ouchi, Y. Nagano, K. Suzuki, S. Nomura, “Salivary dehydroepiandrosterone secretion in response to acute psychosocial stress and its correlations with biological and psychological changes” Biol. Psychol., 79( 3), 294–298, 2008.
- C.W. Hoge, C.A. Castro, S.C. Messer, D. McGurk, D.I. Cotting, R.L. Koffman, “Combat duty in Iraq and Afghanistan, mental health problems, and barriers to care” New Eng. J. Med., 351(1), 13–22, 2004.
- R. N. McLay, W. E. Deal, J. A. Murphy, K. B. Center, T. T. Kolkow, T. A. Grieger, “On-the-record screenings versus anonymous surveys in reporting PTSD” Am. J. Psychiat., 165(6), 775–776, 2008.
- M. Perrin, L. DiGrande, K. Wheeler, L. Thorpe, M. Farfel, R. Brackbill “Differences in PTSD prevalence and associated risk factors among World Trade Center disaster rescue and recovery workers” Am. J. Psychiat., 164(9), 1385–1394, 2007.
- S. Mitsuyoshi, F. Ren, Y. Tanaka, S. Kuroiwa, “Non-verbal voice emotion analysis system” Int. J. Innov. Comput. I., 2(4), 819–830, 2006.
- S. Mitsuyoshi, “Emotion recognizing method, sensibility creating method, device, and software” U.S. Patent 7 340 393, 2003.
- S. Shinohara, M. Nakamura, Y. Omiya, N. Hagiwara, S. Mitsuyoshi, S. Tokuno, “A mental health assessment method based on emotional level derived from voice” (Manuscript in preparation)
- N. Hagiwara, Y. Omiya, S. Shinohara, M. Nakamura, M. Higuchi, S. Mitsuyoshi, H. Yasunaga, S. Tokuno, “Validity of the mind monitoring system as a mental health indicator” in IEEE BIBE 2016, Taichung, 2016.
- A. Sekiyama, “Interleukin-18 is involved in alteration of hipothalamic-pituitary-adrenal axis activity by stress” in Society of Biological Psychiatry Annual Meeting, San Diego, USA, 2007.
- S. Tokuno, S. Mitsuyoshi, G. Suzuki, G. Tsumatori, “Stress evaluation by voice: a novel stress evaluation technology” in 9th International Conference on Early Psychosis, Tokyo, 2014.
- S. Shinohara, S. Mitsuyoshi, M. Nakamura, Y. Omiya, G. Tsumatori, S. Tokuno, “Validity of a voice-based evaluation method for effectiveness of behavioural therapy” in MINDCARE 2015, Milan, 2015.
- Y. Omiya, N. Hagiwara, T. Kirita, S. Shinohara, M. Nakamura, S. Mitsuyoshi, S. Tokuno, “Development of a monitoring system of mental health state using call voice with a smartphone” in HCG symposium, Toyama, 2015.
- Y. Omiya, “Development of the mind monitoring system (MIMOSYS) which can be able to monitor mental health status using call voice with a smartphone” in 7th Asia Pacific Regional Conference of IASP, Tokyo, 2016.
- S. Mitsuyoshi, Y. Tanaka, F. Ren, K. Shibasaki, M. Kato, T. Murata, T. Minami, H. Yagura, “Emotion voice analysis system connected to the human brain” in IEEE NLP-KE 2007, Beijing, China, 2007.
- D. P. Goldberg, Manual of the General Health Questionnaire, NFER Publishing, Windsor, England, 1978.